Let’s check in on the NWMLS statistics from around the sound.
Here’s where the YOY stats stand for each of the six counties as of November 2008:
(Note: The “Sales” data below represents pending sales, not closed sales.)
King – Price: -9.2% | Listings: +2.2% | Sales: -21.2% | MOS: 8.7
Snohomish – Price: -11.1% | Listings: -1.6% | Sales: -24.3% | MOS: 11.2
Pierce – Price: -13.2% | Listings: -10.0% | Sales: -14.7% | MOS: 10.1
Kitsap – Price: -2.1% | Listings: -5.6% | Sales: -25.0% | MOS: 13.3
Thurston – Price: -6.8% | Listings: -7.5% | Sales: -22.9% | MOS: 9.3
Island – Price: +14.1% | Listings: -1.3% | Sales: -25.0% | MOS: 20.5
Skagit – Price: -0.8% | Listings: +3.0% | Sales: -35.5% | MOS: 15.1
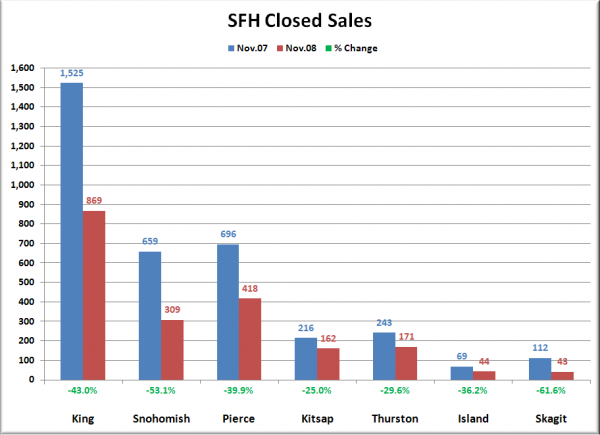
Since the massive drop in closed sales was particularly notable this month, here’s a bonus chart comparing each county’s closed sales for November 2007 and November 2008.
Snohomish and Skagit counties saw larger year-to-year declines in closed sales than King.
The graphs below only represent the market action since January 2006. If you want to see the long-term trends, feel free to download the spreadsheet (or in Excel 2003 format) that all of these graphs come from, and adjust the x-axis to your liking. Also included in the spreadsheet is data for Whatcom County, for anyone up north that might be interested.
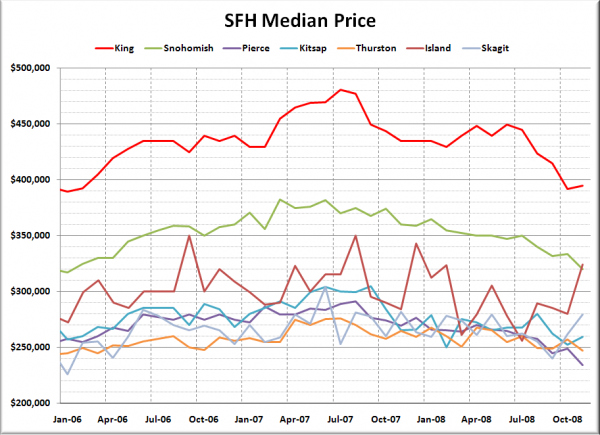
First up, it’s raw median prices.
Median prices actually increased month-to-month in King, Kitsap, Island, and Skagit counties, while declining in Snohomish, Pierce, and Thurston. Prices fell the most in Pierce County, where $14,699 was knocked off the median from October. Meanwhile, with a paltry 44 closed sales, Island County’s median actually shot up $44,000, a 14% YOY increase. I’m sure that’s representative of the market up there (yeah right).
Here’s how each of the counties look compared to their peak:
King – Peak: July 2007 | Down 17.9%
Snohomish – Peak: March 2007 | Down 16.3%
Pierce – Peak: August 2007 | Down 19.6%
Kitsap – Peak: September 2007 | Down 14.8%
Thurston – Peak: July 2007 | Down 10.5%
Island – Peak: August 2007 | Down 7.4%
Skagit – Peak: June 2007 | Down 8.1%
Not surprisingly, King, Pierce, and Snohomish continue to lead the pack in overall declines. Pierce County took the new lead in November, with median prices down nearly 20%. Over in Island County, even though the median shot up $44k in a month, they’re still off 7.4% from the peak.
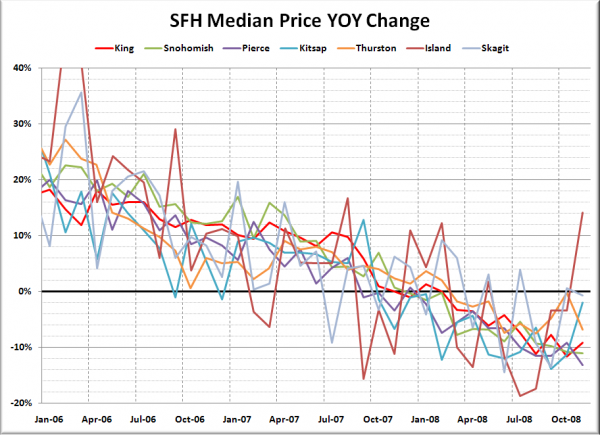
Here’s another take on Median Prices, looking at the year-to-year changes over the last two years.
The wildly noisy median price in Island was the only one to make it into positive YOY territory in November, with price declines in the other counties ranging from -0.8% in Skagit to -13.2% in Pierce. With the continued steady price declines in Pierce, it doesn’t look like the foreclosure situation down there is likely to improve soon.
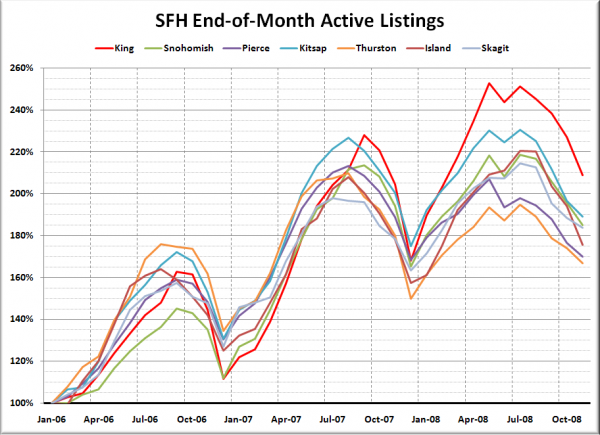
Here’s the graph of listings for each county, indexed to January 2006.
Same story as most recent months, with inventory in King still coming in with a far greater increase than any other county, and overall standing inventory steadily declining across the Sound.
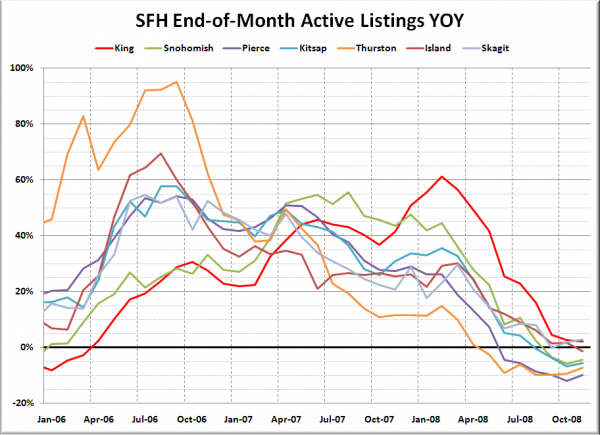
Here’s a look at the YOY change in listings.
King and Skagit were the only counties to have more homes on the market than November last year, with less than 5% gains in each county. The largest inventory drop was 10% in Pierce.
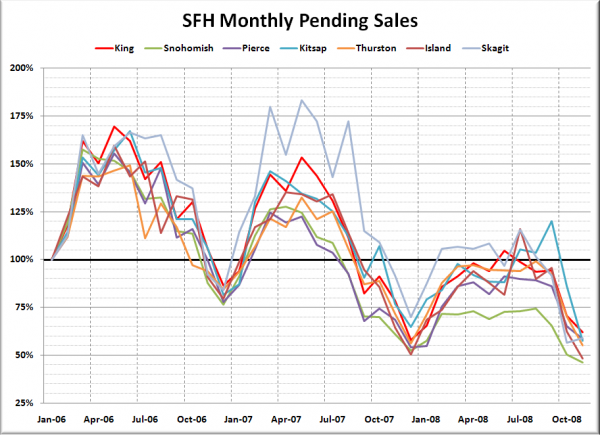
Pending sales, also indexed to January 2006:
Pending sales marked moderate declines in every county but Skagit, which actually increased from 68 pendings in October to 71 in November. Woo, time to party. Unfortunately, pending sales in Snohomish and Island counties were so dismal in November that I had to adjust the vertical scale on this graph.
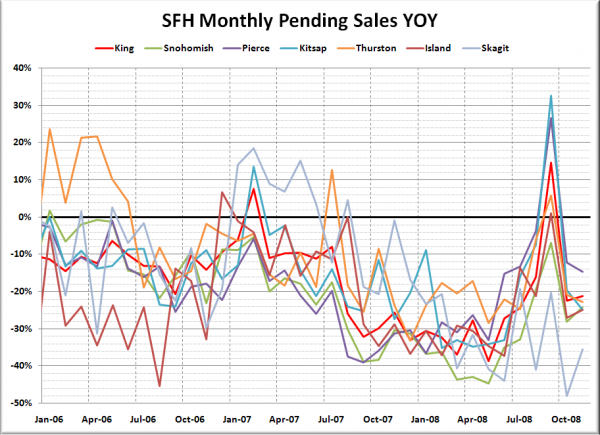
Lastly, here’s the YOY graph of sales:
After the big spike up and then back down, year-over-year sales have settled back down in most counties. The biggest drop was in Skagit, where pendings fell 35.5%.
Months of Supply was pretty interesting this month. While Island has been sky high for some time, in November their MOS shot up to over 20. Yowza. Not a good time to be selling a home in Island County. Also, even though King County’s MOS is at its highest point ever at 8.7, it was the lowest of the Puget Sound Counties in November.
