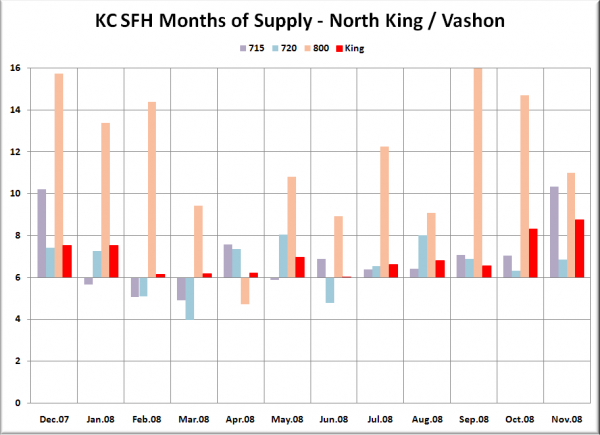
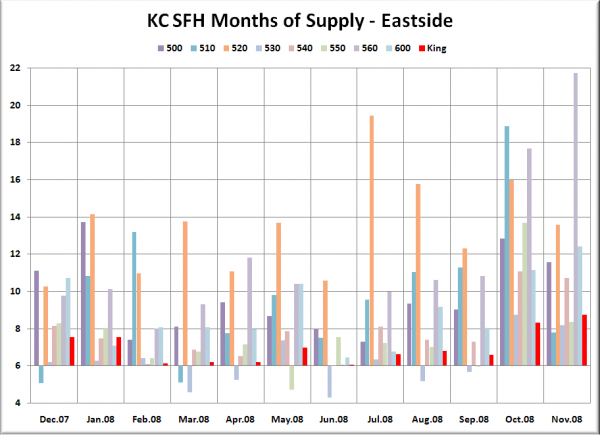
Let’s close out the week with a look at “Months of Supply” for the 30 NWMLS areas in King County. For an explanation of what months of supply means, please refer to the original neighborhood MOS breakdown post. Also, view a map of these areas here.
November MOS for King County as a whole came in at a record-high 8.75 (compared to 6.74 for November 2007 and 8.33 for October), bringing the record run of 6+ MOS to fifteen months.
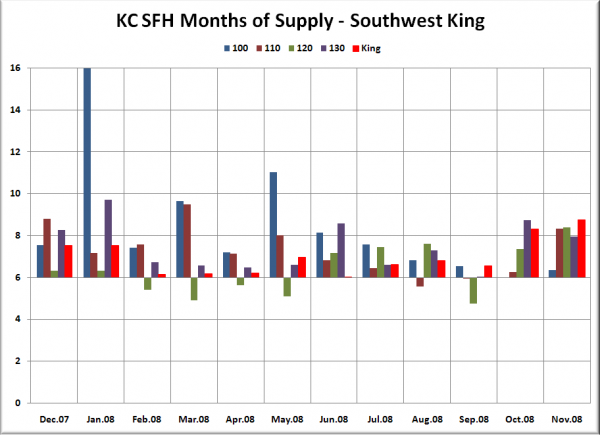
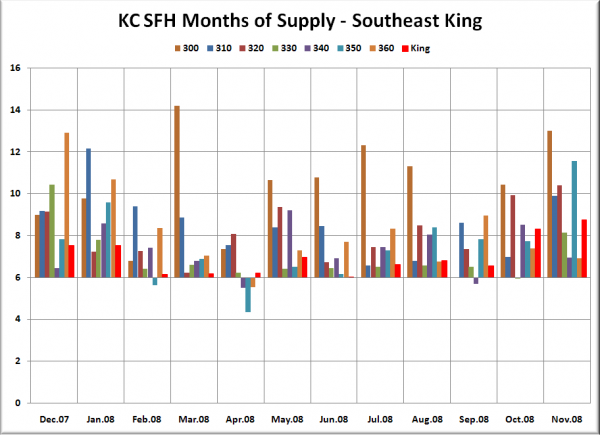
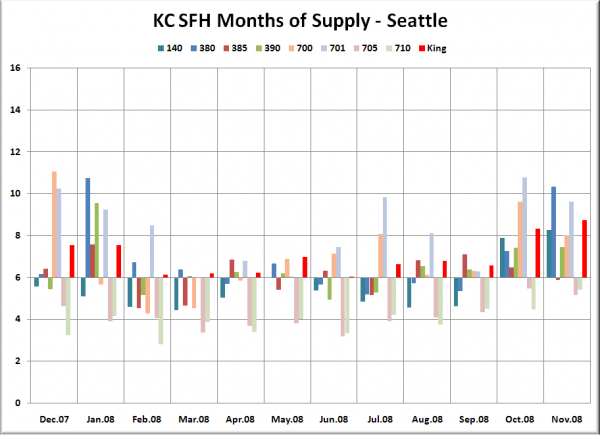
In the graphs below, you’re looking at the MOS for the “Res Only” data from the NWMLS King County Breakout pdfs for the one-year period of December 2007 through November 2008. The bar graph is centered vertically on 6.0 MOS, so that it is easier to visually tell the difference between a seller’s and buyer’s market (i.e. – shorter bars mean a more balanced market). Most of the graphs have the same scale on the vertical axis and has the King County aggregate figure plotted in red on the far right, so they can be easily compared. The Eastside is the one exception, since MOS is getting so high over there, too much information was being cut off to keep the same scale.
Note that there are a few areas that appear to have no bar at all for a given month—this represents an MOS value at or close to 6.0. Also keep in mind that whatever the reason, pending sales have become increasingly disconnected from closed sales recently, which means that these statistics are likely understating the magnitude of the “buyer’s market.”
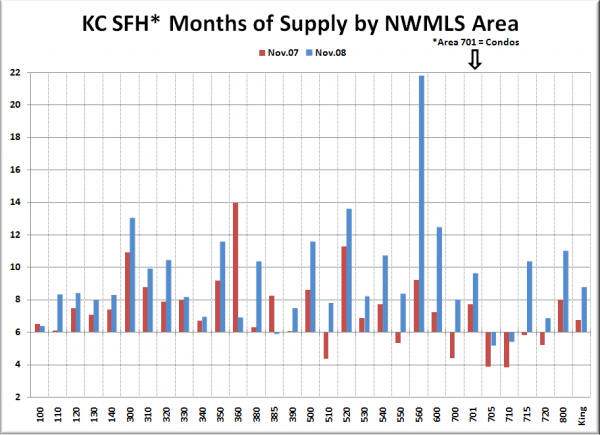
We’ll start off with the chart that lets you directly compare each area’s MOS to its value one year ago. November 2007 is in red, and 2008 is in blue.
Following below are the breakouts for SW King, SE King, Seattle, N King, and the Eastside, as well as a summary of this month’s data.
Note: Area 100 (Jovita/West Hill Auburn) was over 21 in January, and has been clipped.
Note: For Area 701 (Downtown Seattle) we’re using condo data.
Note: Area 800 (Vashon Island) was over 17 in September, and has been clipped.
Note: The vertical scale on the Eastside graph was adjusted to fit the multiple areas with extremely high MOS.
Just like last month, only three of thirty King County areas were in seller’s market territory in October, ranging from 5.16 MOS in 705 (Ballard, Greenlake, Greenwood) to 5.87 MOS in 385 (South-Central Seattle). Note that all three of these “seller’s market” areas are within the city of Seattle.
The cumulative MOS for Seattle proper bumped a bit more into buyer’s market territory at 6.91 in September. The Eastside as a whole actually dropped slightly month-to-month, down to 11.27.
Only three of thirty neighborhoods trended more toward a seller’s market than a year ago. Eleven neighborhoods were above 10 MOS, firmly in buyer’s market territory.
The three toughest markets for sellers were Kirkland-Bridal Trails (560) at a staggering 21.76 (nearly two years), Medina / Clyde Hill / W. Bellevue (520) at 13.59, and Enumclaw (300) at 13.00. 520 continues its 10+ MOS streak, now at 15 months.
The three best markets for sellers as of last month were: Ballard/Greenlake/Greenwood (705) at 5.16, North Seattle (710) at 5.40, and South-Central Seattle (385) at 5.87. No other market had less than 6.0 MOS last month.
