Let’s have a look at December market statistics from the NWMLS.
Here’s the NWMLS press release: Northwest MLS members expecting "market observers" will become "market participants"
Frigid temperatures and record snowfall brought home sales to a standstill for several days in December. The unusual weather, when coupled with the expected holiday slowdown, contributed to a 17.6 percent slide in pending sales compared to the same month a year ago, according to figures from Northwest Multiple Listing Service.
“December typically has a slowdown in sales due to the holidays, but the recent snowfall compounded this seasonal slowing,” said J. Lennox Scott, chairman and CEO of John L. Scott Real Estate. “On the flip side, we should see deferred buyer activity from December pushed into January,” he remarked.
Accurately predicting the spin of real estate “professionals” has become so easy it’s hardly even fun anymore.
Here’s your King County SFH summary:
December 2008
Active Listings: up 6% YOY
Pending Sales: down 16% YOY
Median Closed Price*: $403,500 – down 7.2% YOY
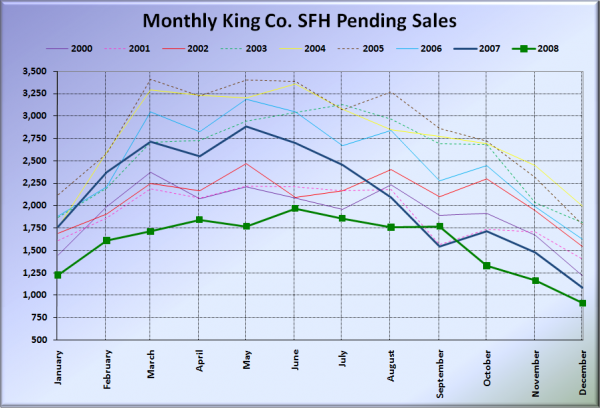
Surprisingly, closed sales in December were actually up month-to-month from November, but still didn’t break the 1k mark. At 929 closed sales, December 2008 is easily the slowest December in modern records, and is the second-slowest month overall.
Here is the updated Seattle Bubble Spreadsheet, and here’s a copy in Excel 2003 format. Click below for the graphs and the rest of the post.
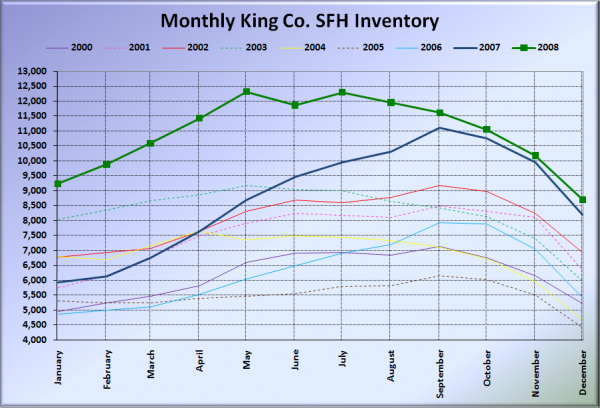
Here’s the graph of inventory with each year overlaid on the same chart.
This year’s drop from November to December was slightly less pronounced than last year. However, there was not enough of a difference to really draw any conclusions.
Whoops. Had to adjust the scale for this chart, as there had not previously been a month with fewer than 1,000 pending sales. But don’t worry, I’m sure now there’s all sorts of “pent-up demand” for January.
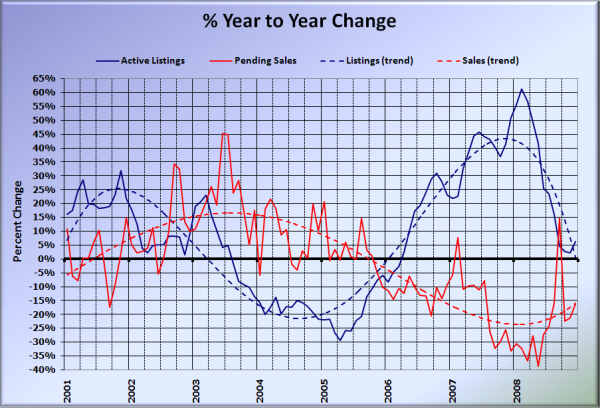
Here’s the supply/demand YOY graph.
Slight increase on the sales side, but still languishing in the -15% to -20% range. The increase in the YOY inventory stat was the first such move since February.
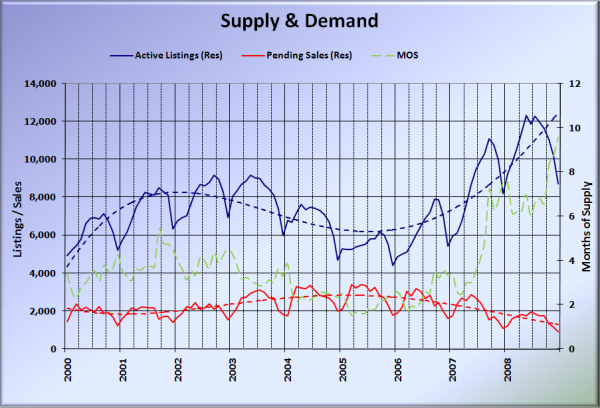
Here’s the chart of supply and demand raw numbers:
Months of Supply for December jumped up yet again, reaching yet another all-time high of 9.56. Yowza. If we keep this up, we’ll hit a full year of supply by summer.
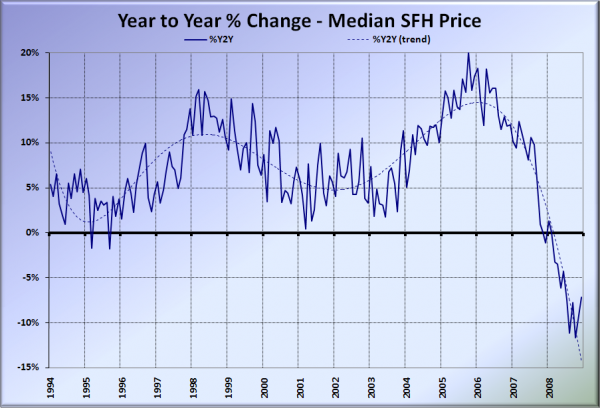
Here’s the median home price YOY change graph:
Is the rate of price declines finally reaching a bottom, or is the mix of sales that make up the very few closed sales each of the recent months just changing toward more expensive homes? We’ll probably have to wait for the December Case-Shiller data to really be sure.
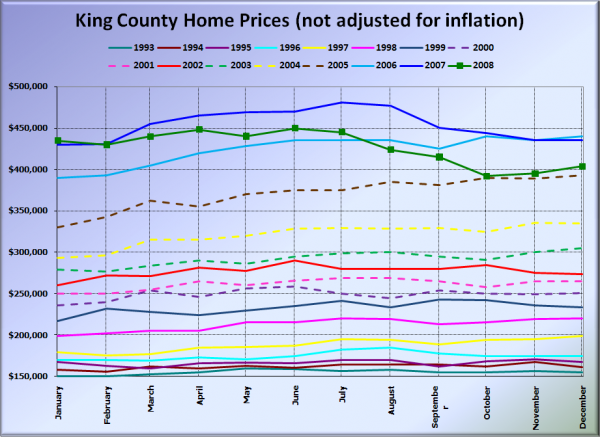
And lastly, here is the chart comparing King County SFH prices each month for every year back to 1994.
December 2008 King County median SFH price: $403,500.
December 2005 King County median SFH price: $393,000.
Here are the news blurbs from the Times and P-I. Check back tomorrow for the full reporting roundup.
Seattle Times: Median home price in King County tops $400,000 again in December
Seattle P-I: County house value up from November
