Let’s check in on the NWMLS statistics from around the sound.
Here’s where the YOY stats stand for each of the six counties as of December 2008:
(Note: The “Sales” data below represents pending sales, not closed sales.)
King – Price: -7.2% | Listings: +6.4% | Sales: -16.1% | MOS: 9.6
Snohomish – Price: -11.2% | Listings: -5.5% | Sales: -13.3% | MOS: 9.6
Pierce – Price: -14.5% | Listings: -9.7% | Sales: -8.5% | MOS: 10.6
Kitsap – Price: -16.4% | Listings: -5.2% | Sales: -19.3% | MOS: 12.8
Thurston – Price: -3.6% | Listings: -4.4% | Sales: +5.4% | MOS: 7.4
Island – Price: -19.0% | Listings: -2.3% | Sales: -6.0% | MOS: 18.3
Skagit – Price: -3.3% | Listings: -0.2% | Sales: -25.0% | MOS: 15.1
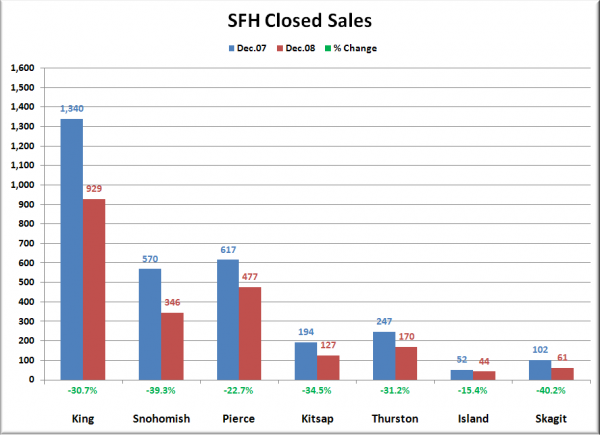
I really liked the simplicity of the closed sales chart I introduced last month, so here it is again, updated for December:
Snohomish and Skagit counties saw larger year-to-year declines in closed sales than King.
The graphs below only represent the market action since January 2006. If you want to see the long-term trends, feel free to download the spreadsheet (or in Excel 2003 format) that all of these graphs come from, and adjust the x-axis to your liking. Also included in the spreadsheet is data for Whatcom County, for anyone up north that might be interested.
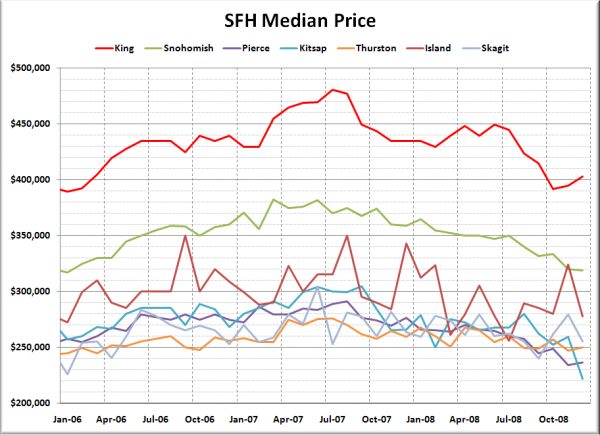
First up, it’s raw median prices.
Median prices increased slightly month-to-month in King, Pierce, and Thurston counties, while declining in Snohomish, Kitsap, Island, and Skagit. Prices fell the most in Island County, where the median dropped $45,592 from November (after increasing by nearly that much the month before). Again though, this was based on a mere 44 closed sales, so it’s you can’t really draw any great conclusions from the dramatic swings in the median.
Here’s how each of the counties look compared to their peak:
King – Peak: July 2007 | Down 16.1%
Snohomish – Peak: March 2007 | Down 16.7%
Pierce – Peak: August 2007 | Down 18.7%
Kitsap – Peak: September 2007 | Down 27.1%
Thurston – Peak: July 2007 | Down 9.4%
Island – Peak: August 2007 | Down 20.7%
Skagit – Peak: June 2007 | Down 16.1%
Ouch. Prices in Kitsap have now fallen over a quarter from the peak, and Island is down just over 20%. The crash is well underway.
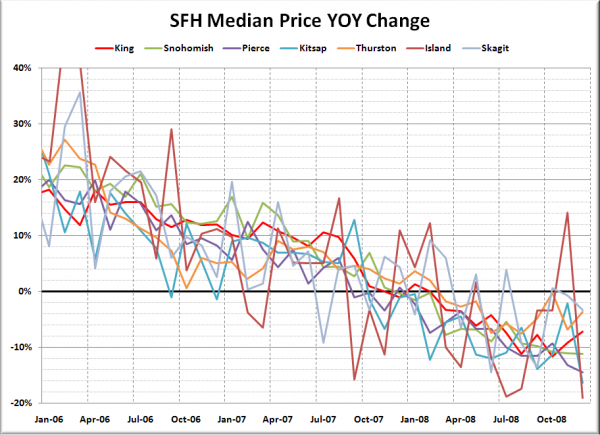
Here’s another take on Median Prices, looking at the year-to-year changes over the last two years.
No county had positive price growth year-over-year. After last month’s wild upward swing in Island County, the YOY data had an even more extreme downward spike in December, coming in with the worst YOY performance of the bunch at nearly 20%.
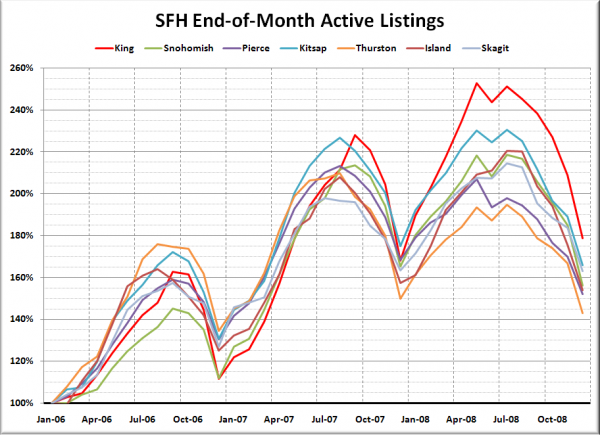
Here’s the graph of listings for each county, indexed to January 2006.
Listings continued their usual winter decline, with King County still coming in slightly ahead of the other Puget Sound counties for overall growth.
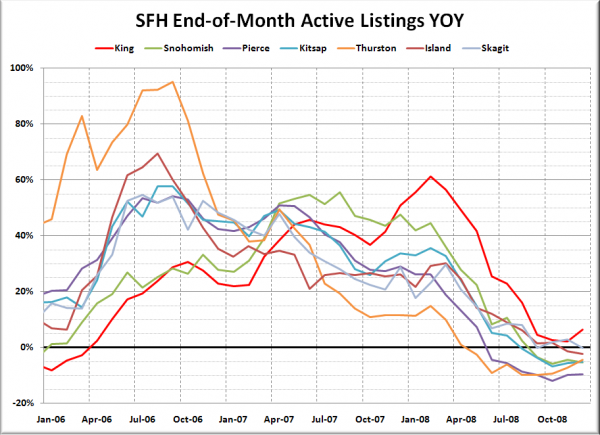
Here’s a look at the YOY change in listings.
King was the only countiy to have more homes on the market than December last year. Pierce had the largest inventory drop again, coming in at about -10% for the second month in a row.
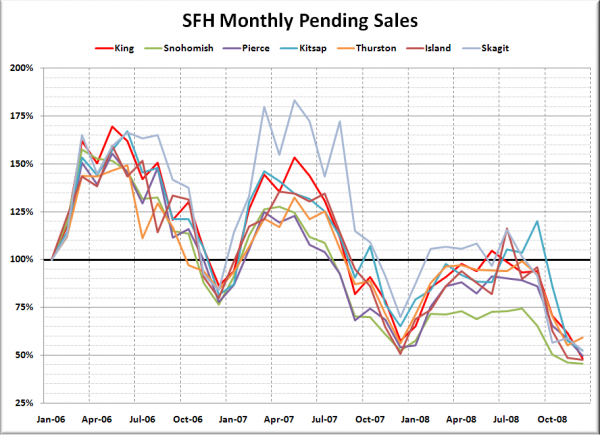
Pending sales, also indexed to January 2006:
Pending sales marked moderate declines in every county but Thurston, which marked an increased of 15 pending sales from November to December. King and Pierce joined Snohomish and Island counties in December in the below 50% club.
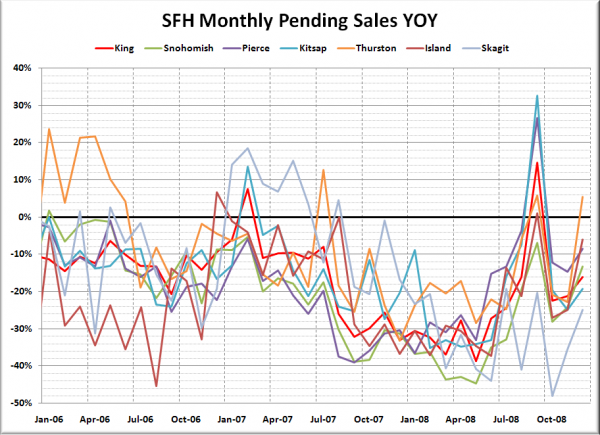
Lastly, here’s the YOY graph of sales:
Only Thurston County marked a year-over-year increase in pending sales from December 2007. Other counties were down between 6% and 25%.
Island County posted over 20 Months of Supply for the second month in a row in December. The county with the lowest MOS in December was Thurston, which came in at 7.4. King and Snohomish tied for second-lowest at 9.6.
