Let’s check out the three price tiers for the Seattle area, as measured by Case-Shiller. Remember, Case-Shiller’s “Seattle” data is based on single-family home repeat sales in King, Pierce, and Snohomish counties.
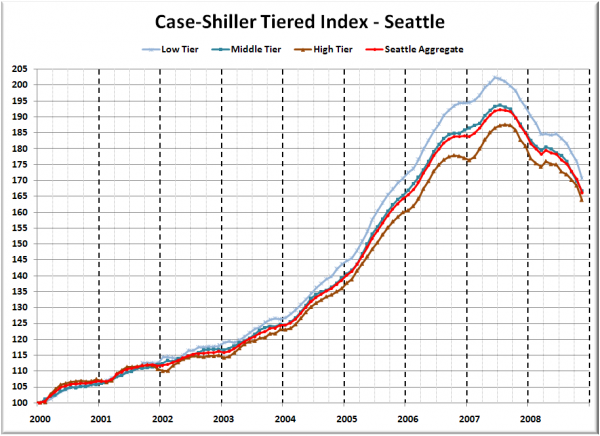
First up is the straight graph of the index from January 2000 through November 2008.
Price declines were sharper in November in all three tiers, with the low tier taking the largest hit—3.1% in a month. The low and middle tiers have now rewound to December 2005, and the high tier to February 2006.
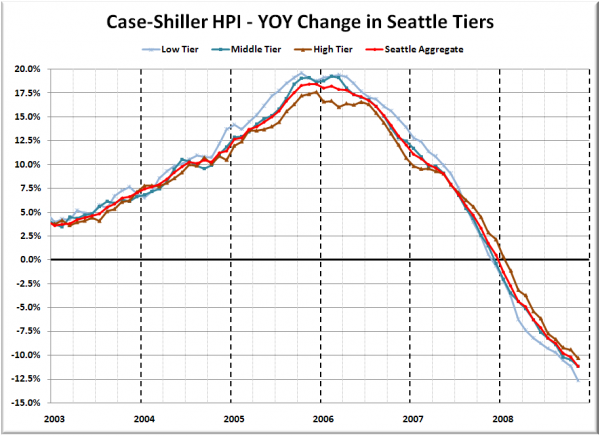
Here’s a chart of the year-over-year change in the index from January 2003 through November 2008.
The low tier continues to hold the title for largest YOY declines. The high tier also dropped under 10% YOY for the first time in November. Here’s where the tiers sit YOY as of November – Low: -12.7%, Med: -11.2%, Hi: -10.3%.
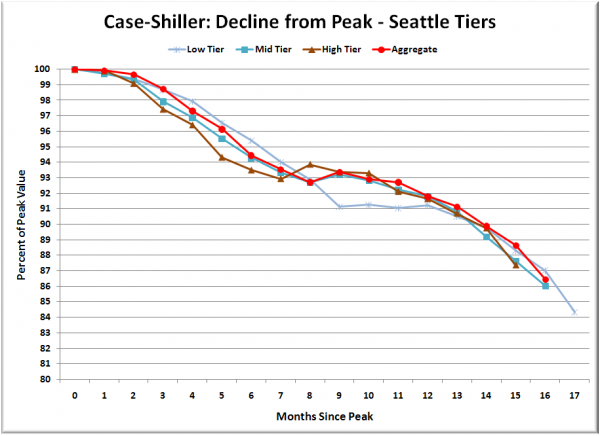
Lastly, here’s a decline-from-peak graph like the one posted yesterday, but looking only at the Seattle tiers.
All three tiers continue to drop at roughly the same rate from their respective peaks.
If price declines continue at the same speed they have averaged over the last six months, over the next year prices in Seattle will rewind back to early 2005. Of course, the chance that price declines will continue at the same speed rather than continuing to accelerate further seems somewhat unlikely at this point.
(Home Price Indices, Standard & Poor’s, 01.27.2009)


