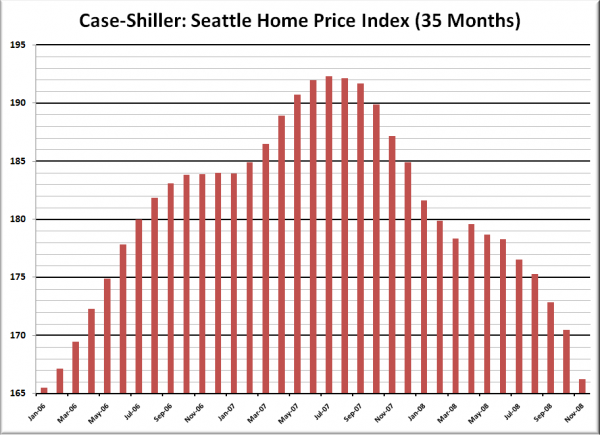
As was noted back in October, graphs of the rise and fall of the Case-Shiller Home Price Index for a number of markets (e.g. San Diego and Seattle) is surprisingly symmetrical.
I’ll be the first to admit that this method hardly qualifies as a rigorous scientific analysis of price trends. The apparent relationship between the run-up and the decline probably has more to do with mass psychology than statistics and math, and it could just be a complete coincidence. However, I thought it would be interesting to essentially just mirror the price run-up to the July 2007 peak, and see where that would put approximate “bottom.”
Here are our basic assumptions for the Simple Mirror forecast:
- The HPI will continue to drop at roughly same rate that it increased leading to the peak.
- The rate of home price increases marked a notable change around January 2004.
- Therefore, January 2004 will be our baseline—the point to which we assume prices will drop.
Given these assumptions, here’s a rough picture of what Seattle’s Case-Shiller Home Price Index would look like through early 2011:

Using the Simple Mirror forecast model, Seattle-area home prices (as measured by the Case-Shiller HPI) will hit bottom sometime around early 2011, giving up just over a third of their peak values.
The overall decline in this forecast would put Seattle’s Case-Shiller HPI at slightly below 4% annual appreciation since the start of the index in January 1990, which incidentally is about where it landed in early 1997 at the end of a seven-year period of relatively stagnant prices following the late ’80s mini-bubble (for a long-term view of Seattle-area home prices check the post King County Home Prices: 1946-2007).
Sixteen months after Seattle’s home-price peak, this simplistic method for predicting home prices is off by less than two percent. Whether the trend will continue is of course anyone’s guess. I’d say it’s a lot more likely that we’ll see a pattern like this than the “V-shaped recovery” predicted by Monday’s inventory forecast.
Method 3: Simple Mirror Forecast (Summary)
Bottom Month: January 2011
Bottom Value: 35.3% off peak
Likelihood*: 20%
* Likelihood is a totally subjective value assigned according to The Tim’s gut feeling. Treat it accordingly.
Bottom-Calling Week on Seattle Bubble
- Introduction: Bottom-Calling Week on Seattle Bubble
- Method 0: Blind Optimism
- Method 1: Inventory-Based Forecast
- Method 2: Dollars per Square Foot Linear Forecast
- Method 3: Simple Mirror Forecast
- Method 4: Affordability Index Forecast
- Method 5: San Diego Lag Forecast
- Conclusion: So Where’s the Bottom?