Whenever local real estate professionals are quoted in the paper lately, it seems that one line we’ve been hearing repeated a lot is about the alleged loads of “pent-up demand” out there.
The thinking goes that there are hundreds thousands upon thousands of potential buyers out there that are “waiting on the sidelines” or “sitting on the fence,” and as soon as the housing market starts to pick back up again, they will all rush in at once and the market will be hot hot hot once again, and the opportunity for good deals will have passed.
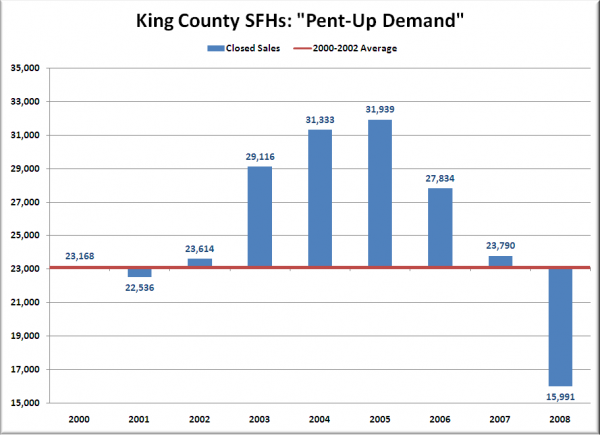
Let’s explore that theory, shall we? In the chart below I have plotted total yearly closed sales for 2000 through 2008. The bars are centered on the 2000-2002 average (23,106), to give us an approximate visual of how each year compares to the pre-bubble housing market.
The “pent-up demand” that the local real estate salespeople love to talk about so much is represented in that big dip in 2008, where sales fell over 30% below our 2000-2002 baseline.
However, the chart also tells a story that you never hear real estate salespeople talk about… From 2003-2006, demand was far above the baseline, with average excesses of 30% for four straight years. This is what I like to refer to as “borrowed demand.”
The total borrowed demand from 2003-2006 was 27,798 sales. The demand shortfall in 2008 was a mere 7,115 sales, enough to “pay back” 26% of the borrowed demand of the bubble years.
Is there some pent-up demand? Probably a little bit, but in reality, the amount of pent-up demand out there will likely still be dwarfed by the amount of borrowed demand that still must be paid back.
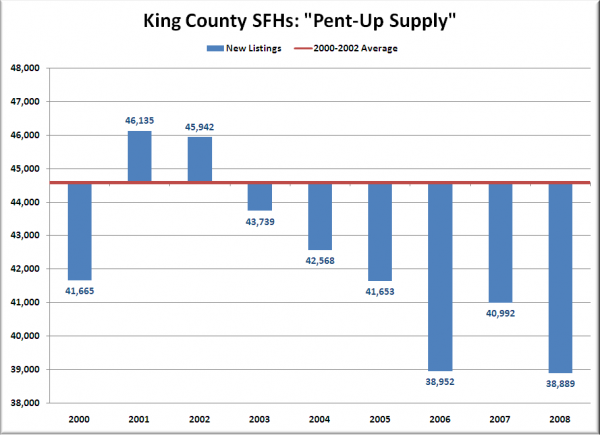
Of course, this all completely ignores the other side of the equation: “pent-up supply.” The chart below plots new listings in the same manner as the closed sales chart above.
Wow, so during the bubble years, supply was actually slightly lower than the baseline (44,581), averaging 4.3% under the 2000-2002 average from 2003-2005. In 2006-2008, supply has been about 11% under average.
Looked at in the same way as the pent-up demand picture, we’re currently sitting on between 15,000-20,000 homes across the county that represent pent-up supply.
So, to sum up: The borrowed demand from the bubble years has still left us with a demand deficit in excess of 20,000 sales, while the lower than usual new inventory of the last few years has built up a pent-up supply of around 15,000 homes.
Admittedly, this is a rather coarse method of investigating the issue of pent-up demand and pent-up supply, but it’s probably the best we can do with the limited hard data that is available. I’m interested to hear what you think about the issue, especially if you’re an agent that has been using “pent-up demand” as a scare tactic to attempt to “get buyers off the fence.”

