There have been a couple of discussions in the comments section in the last week or so about the relationship between home prices and incomes. I thought it would be a good time to queue up a post about the long-term price-to-income trends, where we are now, and what the possible outcomes could be.
The analysis in this post are all based on annual data for King County for the period from 1969-2008 – a period that covers five recessions. For home prices, I used the King County MLS median price for SFH, pulled from The Tim’s long-run home price chart. Tim’s data in this series shows home values in April and October of each year. I used the October data. For income, I pulled the data for King County Personal income per capita (PCI) from www.bea.gov. This time series runs from 1969-2007. In order to estimate PCI for 2008, I grossed up the 2007 figure by 1%, which was the estimate of Median HHI income growth for King County by the Washington Office of Financial Management (OFM).
[Note from The Tim: For a more granular look at the short-term price-to-income trend since 1990, hit this post.]
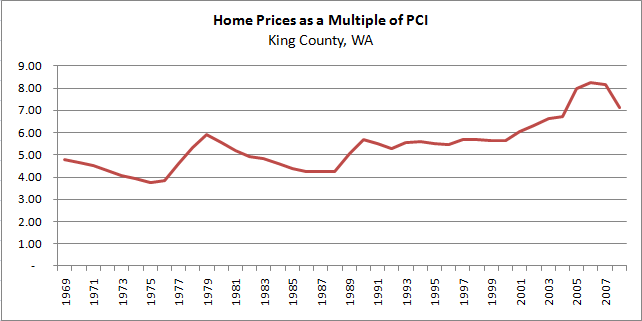
The first analysis is a simple line chart showing the historical ratio of home prices to income. Here we can see that, up until the turn of the century, home prices bounced around in a fairly narrow range when expressed as a multiple of incomes. The multiple is closer to 4x in times of economic duress (e.g. the oil crisis and mid-eighties recession) and rises up closer to 6x in better times. But the average multiple of home prices to incomes between 1969 and 2000 was almost exactly 5x. Then, as lending rules are eased in 2001 – we see the multiple grow steadily until it peaks over 8x in 2006, before falling back to 7.1x as of October 2008.

Based on this chart it is pretty clear to me that claims that home prices falling to their “normal state” of 3x income are best discussed on Snopes.com. There is no historical precedent for the median price for homes in the Seattle area being that low relative to income in most of our lifetimes – and even if it has fallen to that level at some point in the past, I doubt home prices have averaged 3x income for any extended period of time. Based on the last ~40 years the “bottom” for home prices based on the income multiple appears to be about 4x incomes.
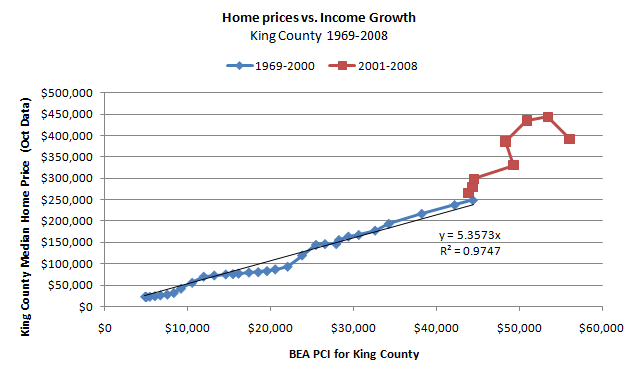
The second analysis uses the same data, but presents the results as a scatterplot. Here we can see even more clearly the impact of the changes in lending standards in 2001. From 1969 to 2000, the relationship between home prices and incomes (shown in blue) follows an almost linear path. The r-square between these two time series is over 97%. Using a “best fit” line shows that the best predictor for home prices as a multiple of incomes during this time period is 5.35x – slightly higher than the mathematical average from the analysis above – but probably a slightly better estimate of the long run trended value.

The red points clearly show home prices diverging from the long-run trend line in 2001, and moving back toward it beginning in 2007. I think this is the starkest evidence I have seen showing how the “fundamentals” of income as a driver of home values disappeared in the boom. After tracking income for 30+ years, home prices set off on their own path just as new financing vehicles and standards were introduced to the market.
This chart also casts doubt on that the claim that the boom “started late” in Seattle. You can clearly see that home prices were shooting up relative to incomes in 2001 and 2002, before leveling off slightly in 2003. The perception that we were not “booming” was probably due to income growth being depressed by the end of the dot com boom and the stock market crash – but the ratio of home prices to incomes was steadily increasing.
I also ran an analysis comparing the annual change in home prices to the annual change in incomes. This is a “purer” analysis because with two trended series (e.g. home prices and incomes) a large portion of the explanatory value is the result of autocorrelation. I haven’t clipped the graph in here, but the r-square for this analysis was 0.3 – which is pretty high for a single variable regression using two fairly noisy series. It was enough to satisfy my curiosity, as I am entirely comfortable with the premise the primary driver of home prices is income levels, all other things being equal (e.g. financing terms, relative supply)
Based on this comparison, my observations are as follows:
- This is evidence to me that we are clearly still far from the bottom. Depending on your viewpoint, prices should fall back at least to the long-run income multiple (I’ll use 5.35x) and could drop as low as 4x. Based on this data series, I see no precedent for a lower multiple.
- King County PCI for 2008 should be about $55k, and given the state of the economy it will probably stay about the same in 2009 . Applying those income multiples would indicate the King County median would “bottom” somewhere between $220k and $295k.
- The April median for King County SFH was $380k, indicating a possibility of 22-42% of additional downside risk
For home prices to fall much further than this (e.g. the super-bear’s $100k prediction), it seems to me that one or more of the following things would have to be true:
- Home price/income multiples would have to diverge greatly from 30+ years of historical precedence
- Incomes would have to fall dramatically
- Lending standards would have to be tightened dramatically from their pre-bubble standards. (A simple increase in rates should not be a unique condition, as the period of this analysis includes the double digit rates in the early ’80s)
- Some other extraordinary event would have to take place such as a change in the tax treatment of real estate.
Note that I am not saying any of these things won’t happen. But it does seem to me that conditions would have to change quite dramatically to result in that extreme of a drop in values. As of today, it appears incomes are relatively stable, lending standards have (for the most part) returned to pre-bubble conditions, and home prices are trending back to the long run income multiple.
My caveat: This analysis is not intended to be predictive. It is intended as additional information from which you, the reader can generate your own opinions about where the housing market is going and make an informed decision on a housing purchase during a period of great uncertainty. Hopefully it will generate good discussion in the comments section.