It’s time for our regularly-scheduled check on NWMLS statistics from around the sound. Once again, courtesy Tableau Software, the Around the Sound update is rocking exclusive interactive data visualizations.
After about 5:00 today, data will be updated in the old charts in Excel 2007 and Excel 2003 format. To get specific info about a certain point on any graph in the post below, float your mouse pointer over the data.
Before we get to the cool stuff, here’s the usual table of YOY stats for each of our seven covered counties as of May 2009.
(Note: The “Sales” data below represents pending sales, not closed sales. Keep in mind that certain NWMLS definitions were modified beginning July 2008 that affect the reported number of active listings and pending sales (and therefore the “months of supply”). The net result of this change is that active listings post 07/08 will appear lower, pending sales higher, and months of supply lower than prior to 07/08. See this post for more details.)
King – Price: -14.8% | Listings: -20.0% | Sales: +27.2% | MOS: 4.4
Snohomish – Price: -11.4% | Listings: -24.8% | Sales: +39.5% | MOS: 4.8
Pierce – Price: -13.5% | Listings: -28.5% | Sales: +28.8% | MOS: 4.9
Kitsap – Price: -9.6% | Listings: -29.7% | Sales: +38.3% | MOS: 5.3
Thurston – Price: -5.8% | Listings: -23.9% | Sales: +17.6% | MOS: 4.1
Island – Price: -14.1% | Listings: -9.1% | Sales: +17.2% | MOS: 10.4
Skagit – Price: -25.3% | Listings: -2.5% | Sales: +1.5% | MOS: 9.0
Whatcom – Price: -1.1% | Listings: -14.5% | Sales: +29.9% | MOS: 5.4
Hit the jump for the interactive charts.
Summary

The visualization below is comparable to our usual chart of closed sales in each county in May 2008 and May 2009:
Closed Sales
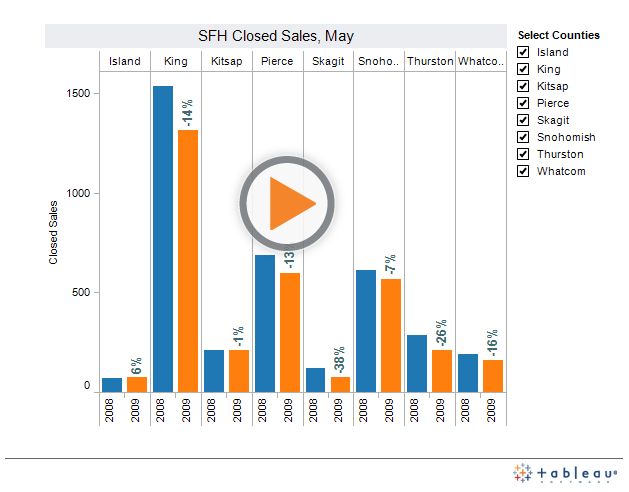
Closed sales in Island were actually up over 2008, while Kitsap and Snohomish were only down by a small amount. Everywhere else saw declines in excess of 10%, despite the still-surging pending sales.
Here’s our comparison of median prices in each county at their respective peaks and in May 2009:
Change from Peak

Skagit County surged into the lead in May with the median there off nearly a third from the peak. Most other counties came in around 20% off, with Thurston still showing the most strength at less than 10% off.
Months of Supply

Again, this chart has been rendered mostly meaningless with the change in “pending” definition by the NWMLS. I am working on integrating the SAAS measure into these charts for future updates for a better picture of actual market activity.
Nothing much changed from what we’ve seen earlier this spring. The market is gaining a little bit of strength, but nothing more than the seasonal uptick we would expect to see any given spring.