Let’s take a look at July market statistics from the NWMLS. The NWMLS press release has not been posted yet, but should be available here later today.
Here’s your King County SFH summary, with helpful arrows to show whether the year-over-year direction of each indicator is positive or negative news for buyers and sellers:
| July 2009 | Number | MOM | YOY | Buyers | Sellers |
| Active Listings | 9,857 | +2.1% | -19.8% |  |
 |
| Closed Sales | 1,727 | +4.4% | +10.6% |  |
 |
| SAAS (?) | 2.00 | -3.0% | -21.0% |  |
 |
| Pending Sales | 2,217 | -9.4% | +19.5 |  |
 |
| Months of Supply | 4.45 | +12.7% | -32.9% |  |
 |
| Median Price* | $384,000 | -2.8% | -13.7% |  |
 |
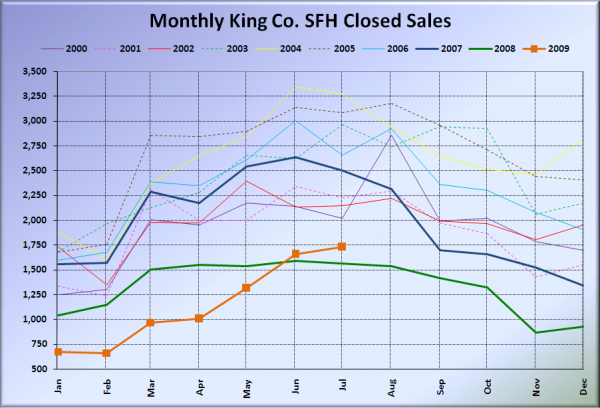
Closed sales increased slightly over June, falling just shy of the 1,750 breakpoint in our May poll. My guess was that closed sales this year would top out between 1,750 and 2000. That may have been a little too optimistic.
Still haven’t broken that 2,000 mark though, despite four months in a row of pending sales in excess of 2,000.
Here is the updated Seattle Bubble Spreadsheet, and here’s a copy in Excel 2003 format. Click below for the graphs and the rest of the post.
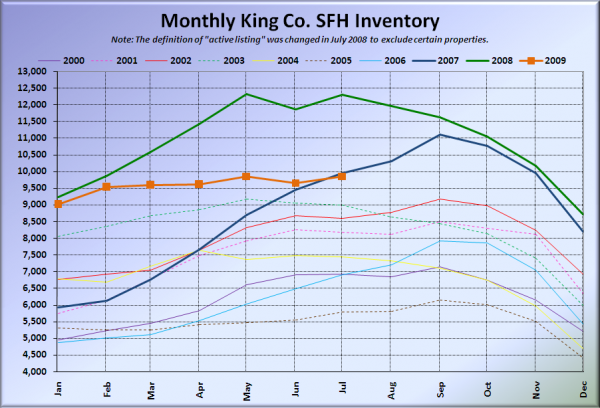
Here’s the graph of inventory with each year overlaid on the same chart.
July came at about the same level as 2007. I wouldn’t be surprised to see some more inventory growth this year between now and September, but we probably won’t hit the 11,000 mark again.
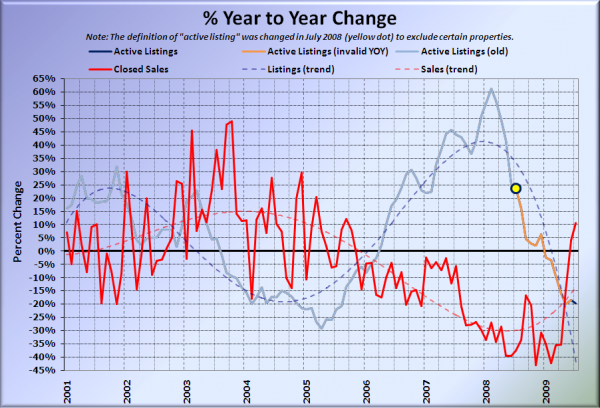
Here’s the supply/demand YOY graph. In place of the now-unreliable measure of pending sales, the “demand” in the following two charts is now represented by closed sales, which have had a consistent definition throughout the decade.
Another slight YOY increase for sales in July. Looks like the tax credit and the increased time that it is taking for deals to actually close have managed to stretch this year’s buying season out a little longer than usual.
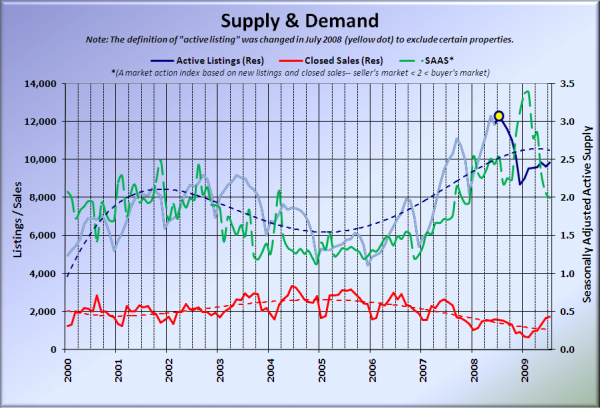
Here’s the chart of supply and demand raw numbers:
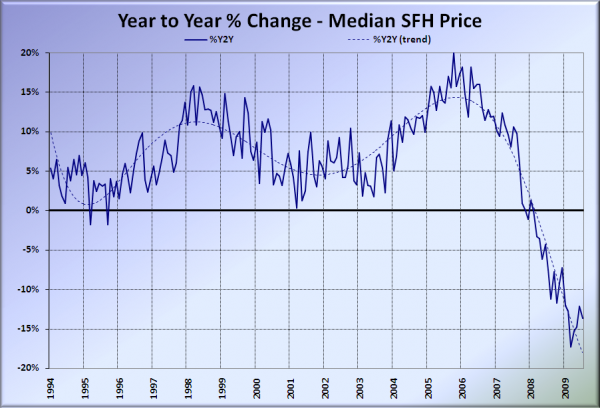
Here’s the median home price YOY change graph:
No big surprise there. The median price measure is notoriously noisy, and it continues to oscillate up and down.
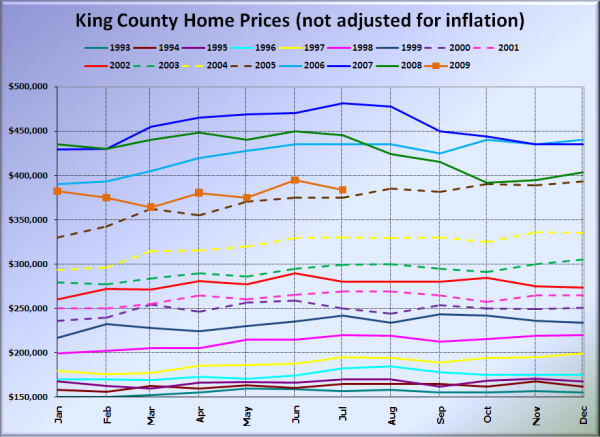
And lastly, here is the chart comparing King County SFH prices each month for every year back to 1994.
So far, 2009 is tracking pretty closely to 2005. July 2009’s SFH median was just $1,000 under the August 2005 SFH median.
I’ll update this post with news blurbs from the Times and P-I when they become available. As usual, check back tomorrow for the full reporting roundup.
[Update:]
Seattle Times: King County home sales climb to two-year high in July
Seattle P-I: Home sales up more than 10 percent in King County
KING 5: Home sales up despite heat wave
I’m sensing a theme…
