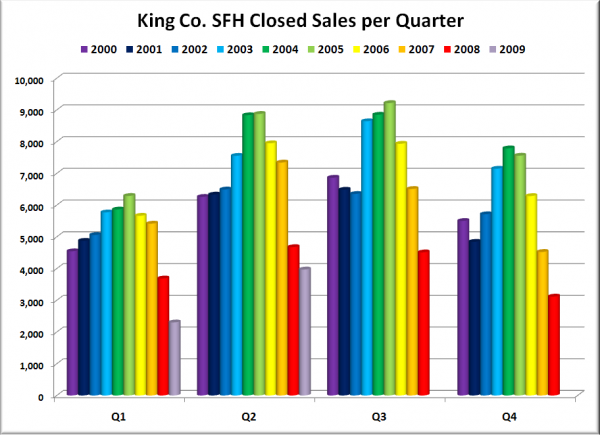
Here’s a belated look at the quarterly total sales chart, updated to include Q2:
Still came in lower than any previous quarter—about 15% lower than last year. So far this quarter is off to a stronger start, with July sales coming in 11% higher than last year. It will be interesting to see if that holds for August and September.
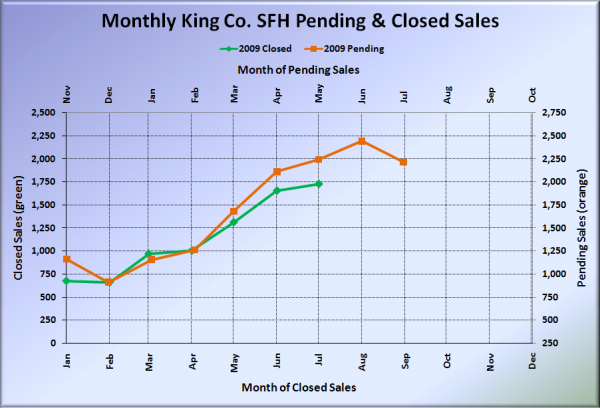
Next, here’s another look at the monthly pending and closed sales chart, only this time I have split the pending sales onto separate vertical and horizontal axis to demonstrate the apparent two-month lag that has shown up in the data this year:
It used to be (from 2000-2007) that a given month’s closed sales were (on average) about 95% of the previous month’s pending sales. So far this year the relationship has been closer to a given month’s closed sales coming in at 78% of the total pending sales from two months prior.
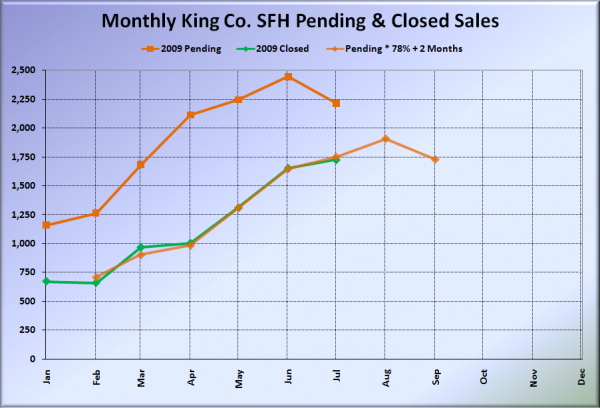
Here’s one more chart, with pending sales, closed sales, and a plot of pending sales * 78%, shifted two months into the future:
If this relationship holds for August, it looks like we’ll see about 1,900 closed sales.


