Let’s have a look at October market statistics from the NWMLS. Here’s the NWMLS press release: Tax credit spurs big surge in Western Washington home sales.
Here’s your King County SFH summary, with the arrows to show whether the year-over-year direction of each indicator is positive or negative news for buyers and sellers:
| October 2009 | Number | MOM | YOY | Buyers | Sellers |
| Active Listings | 8,869 | -5.2% | -19.7% |  |
 |
| Closed Sales | 1,758 | +8.7% | +33.3% |  |
 |
| SAAS (?) | 1.61 | -11.4% | -27.9% |  |
 |
| Pending Sales | 2,295 | +0.3% | +72.9% |  |
 |
| Months of Supply | 3.86 | -5.5% | -53.6% |  |
 |
| Median Price* | $377,500 | -1.2% | -3.7% |  |
 |
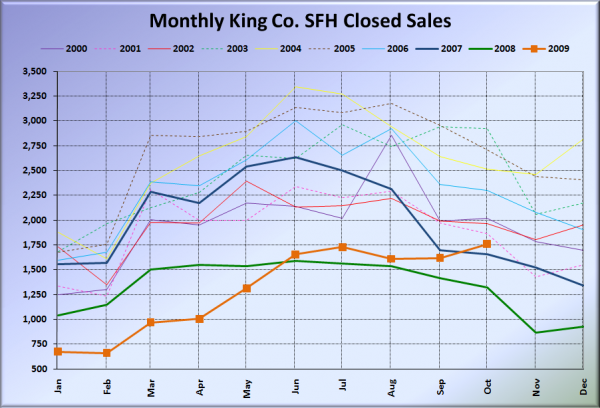
In a great big surprise to absolutely nobody, closed sales bumped up in a seasonally unnatural pattern in October, no doubt due to the belief many buyers had that the $8,000 tax credit would be expiring at the end of November (it is now foolishly being renewed and extended, pushed through Congress on the back of an unrelated extension of unemployment benefits).
At this point it still looks unlikely that closed sales will manage to break through the 2,000 mark this year. In the past, closed sales have fallen an average of 15% from October to November. I suspect that this year we may see sales hold steady or possibly even post a slight increase, but a 14% increase would be surprising, especially with the tax credit now having been extended.
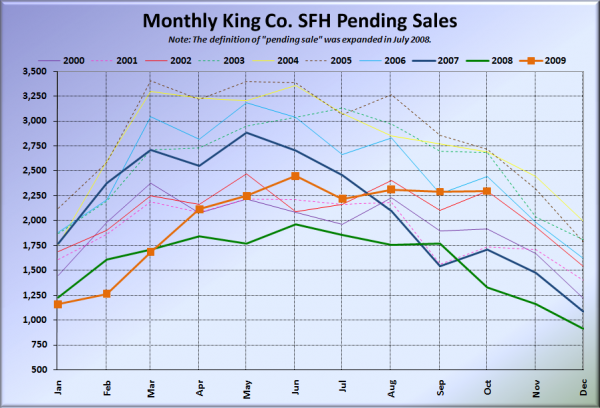
Here’s how the closed sales situation is shaping up compared to previous years:
Thanks to an apparent abundance of eager homebuyers that aren’t very good at math, closed sales made a clear break from the trend seen every other year since 2000, ticking up from September to October. I expect a similar market distortion to appear next month as well.
Feel free to download the updated Seattle Bubble Spreadsheet, and here’s a copy in Excel 2003 format. Click below for the rest of the usual monthly graphs.
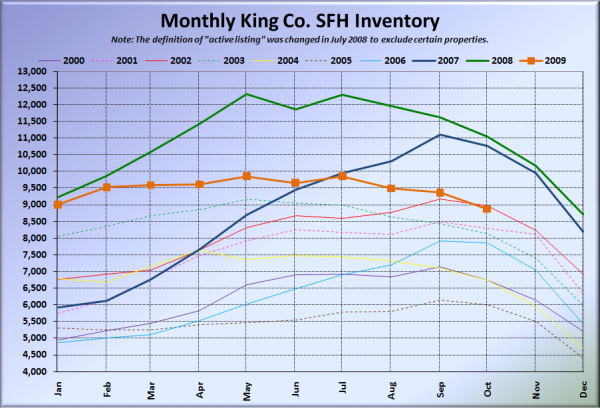
Here’s the graph of inventory with each year overlaid on the same chart.
The tax credit isn’t having much of an effect on inventory, which pretty much followed the usual seasonal pattern.
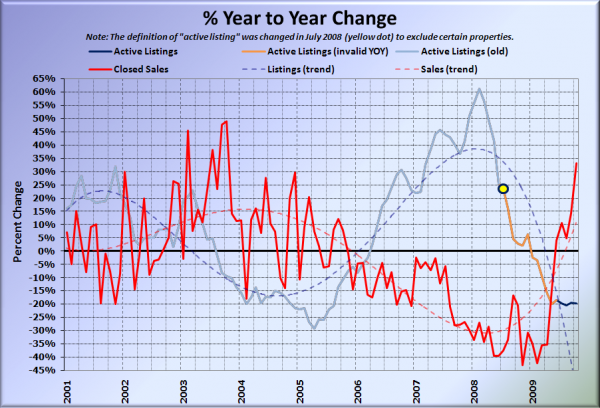
Here’s the supply/demand YOY graph. In place of the now-unreliable measure of pending sales, the “demand” in the following two charts is now represented by closed sales, which have had a consistent definition throughout the decade.
Only 2003 had YOY sales increases in excess of what we saw for October. I’m starting to sense a Cash-for-Clunkers-esque hangover coming this winter…
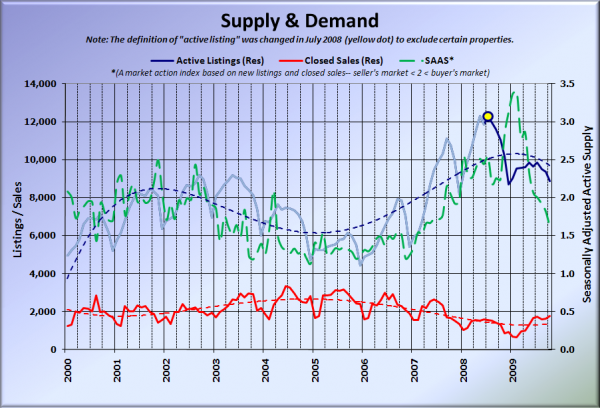
Here’s the chart of supply and demand raw numbers:
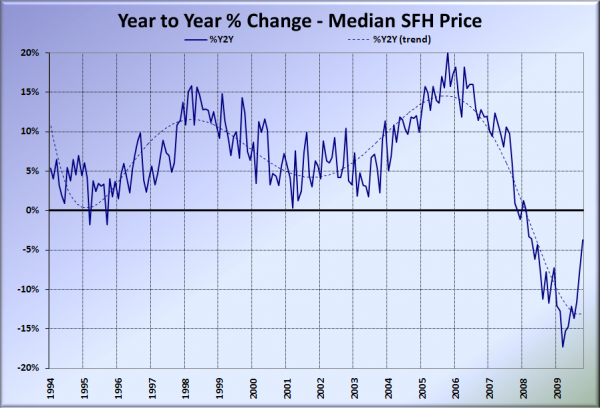
Here’s the median home price YOY change graph:
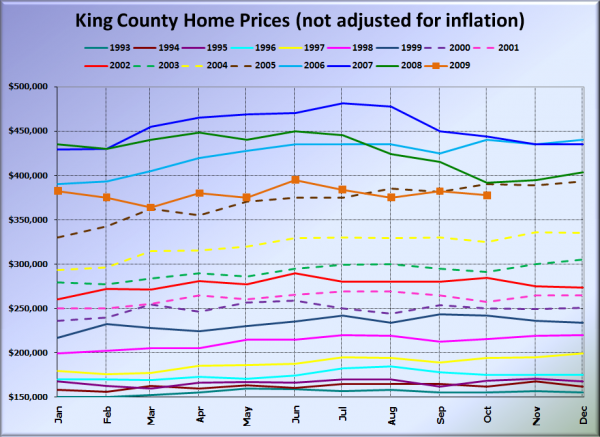
And lastly, here is the chart comparing King County SFH prices each month for every year back to 1994.
Still floating along around 2005 pricing. July 2005: $375,000. October 2009: $377,500.
Here’s a few news blurbs to hold you over until tomorrow’s reporting roundup.
Seattle Times: King County home sales climb to ’09 high in October
Seattle P-I: Pending home sales spike, MLS report says
In this particular case, “spike” actually means “stayed flat, but last year plummeted.”
