With November now in the rear view mirror, let’s have a look at the monthly stats preview. Most of the charts below are based on broad county-wide data that is available through a simple search of King County Records. If you have additional stats you’d like to see in the “preview,” drop a line in the comments and I’ll see what I can do.
Here’s your preview of November’s foreclosure and home sale stats:
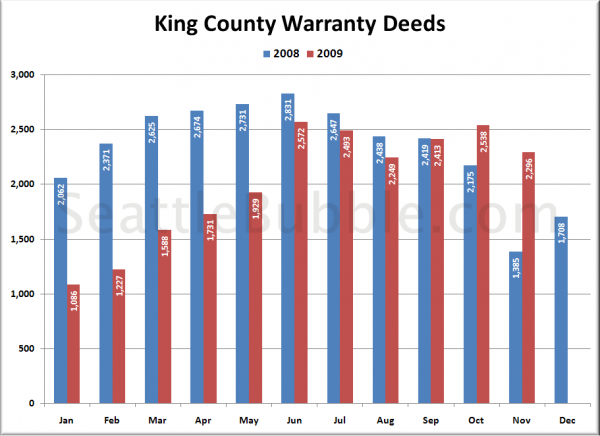
First up, total home sales as measured by the number of “Warranty Deeds” filed with the county:
Not unexpectedly, sales declined slightly month-to-month, but saw a huge year-over-year increase: 66%. Since most of these sales probably went pending well before the tax credit was extended to beyond its original expiration at the end of November, it is not at all surprising so see such a huge surge in closings, and in fact we have been forecasting exactly this phenomenon since early this summer.
I suspect that a large part of this spike will end up having been borrowed from sales that would have otherwise taken place in the already normally slow December through February. Don’t be surprised if we see a massive drop-off of sales next month.
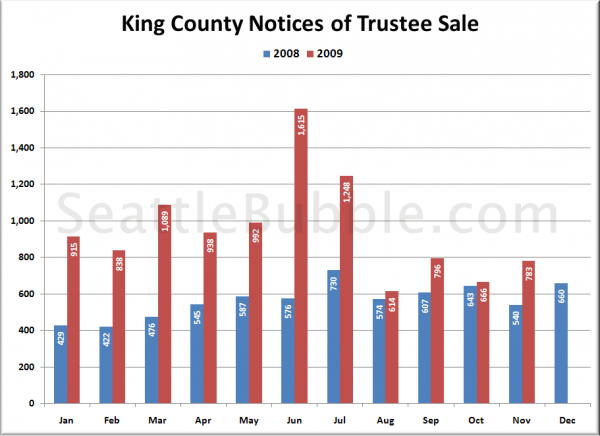
Next, here’s Notices of Trustee sale, which are an indication of the number of homes currently in the foreclosure process:
Still showing a sizable (45%) year-over-year increase, as well as an increase over last month. Since January seems to be when foreclosures around here really started ramping up, it will be interesting to see if we still show a year-over-year increase in a couple months.
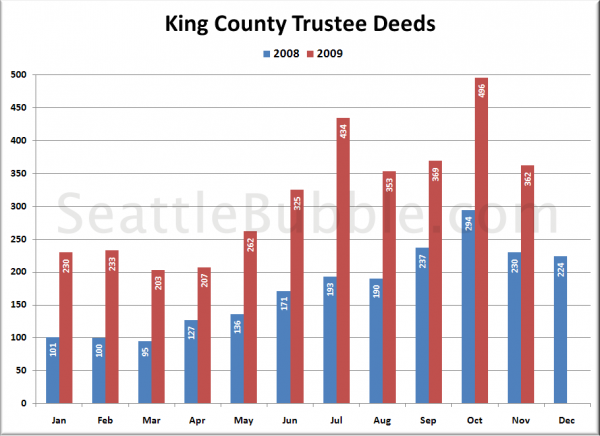
Here’s another measure of foreclosures, looking at Trustee Deeds, which is the type of document filed with the county when the bank actually repossesses a house through the trustee auction process. Note that there are other ways for the bank to repossess a house that result in different documents being filed, such as when a borrower “turns in the keys” and files a “Deed in Lieu of Foreclosure.”
Up 57% from last year, but down from last month, mimicking the pattern seen in trustee sale notices back in June-July.
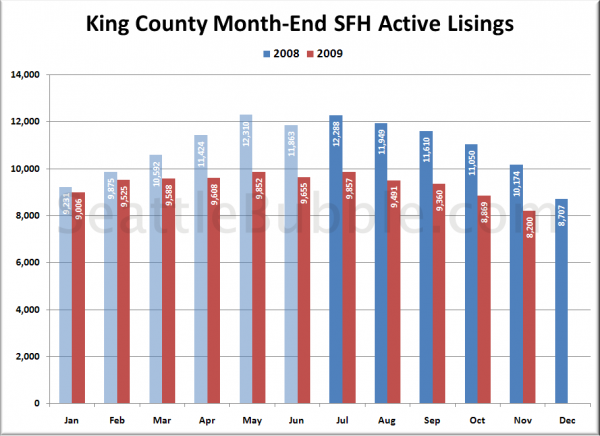
Lastly, here’s an approximate guess at where the month-end inventory was, based on our sidebar inventory tracker (powered by Estately):
Just like every year, the number of homes on the market is declining significantly as we head into the usually “dead” winter months of real estate.
Stay tuned later this month a for more detailed look at each of these metrics as the “official” data is released from various sources.


