Let’s take a look at November NWMLS statistics from around the sound. Unfortunately, I’m a bit behind in updating the cool interactive charts, so a few static snapshots will have to do for this month. You can of course still download the spreadsheets in Excel 2007 and Excel 2003 format.
Here’s our usual table of YOY stats for each of our seven covered counties as of November 2009.
| November 2009 | King | Snohomish | Pierce | Kitsap | Thurston | Island | Skagit | Whatcom |
|---|---|---|---|---|---|---|---|---|
| Median Price |  6.3% 6.3% |
 11.6% 11.6% |
 5.0% 5.0% |
 7.5% 7.5% |
 8.9% 8.9% |
 24.7% 24.7% |
 24.1% 24.1% |
 7.8% 7.8% |
| Listings |  19.2% 19.2% |
 22.2% 22.2% |
 21.4% 21.4% |
 26.4% 26.4% |
 13.7% 13.7% |
 2.1% 2.1% |
 2.1% 2.1% |
 10.9% 10.9% |
| Closed Sales |  81.1% 81.1% |
 120.1% 120.1% |
 81.1% 81.1% |
 55.6% 55.6% |
 59.6% 59.6% |
 86.4% 86.4% |
 162.8% 162.8% |
 87.9% 87.9% |
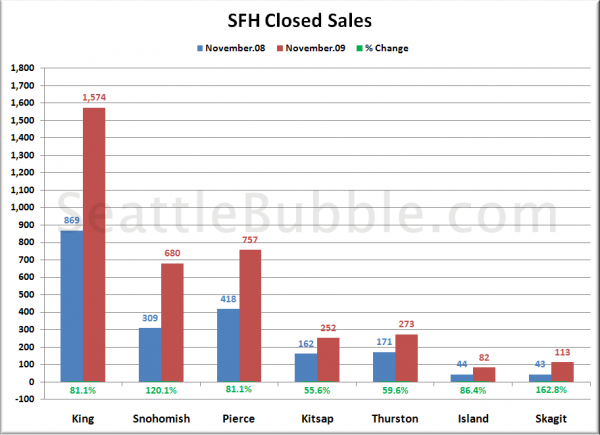
Here’s a simple chart of closed sales in each county in November 2008 and November 2009:
Every county around the sound got a nice closed sales boost from the combination of a cruddy November 2008 and the fake expiration of the homebuyer tax credit. Sales in Snohomish and Skagit were more than double 2008.
Here’s the comparison of median prices in each county at their respective peaks and in November 2009:
Thurston is still turning in the smallest overall decline at 18.5%, while Island and Skagit have both hit over 30% so far. Still no clear sign of a bottom anywhere around the sound.

