Let’s check out the three price tiers for the Seattle area, as measured by Case-Shiller. Remember, Case-Shiller’s “Seattle” data is based on single-family home repeat sales in King, Pierce, and Snohomish counties.
Note that the tiers are determined by sale volume. In other words, 1/3 of all sales fall into each tier. For more details on the tier methodologies, hit the full methodology pdf. Here are the current tier breakpoints:
- Low Tier: < $273,459
- Mid Tier: $273,459 – $404,605
- Hi Tier: > $404,605
The breakpoints for the low tier fell slightly in October, while the high tier breakpoint rose a bit. This is the first time I’ve noticed the two breakpoints moving in opposite directions. It would seem to indicate a wider spread of homes being sold than in recent months.
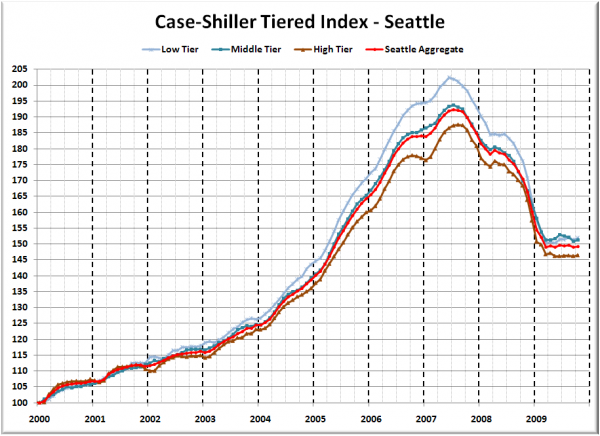
First up is the straight graph of the index from January 2000 through October 2009.
The low tier rose 0.4% month-to-month, while the middle tier rose 0.4%, and the high tier bumped up 0.2%. Only the high tier regained its September losses. The “rewind” situation held steady again, with low tier sitting about where it was in April 2005 and the middle and the high tiers at May 2005 levels.
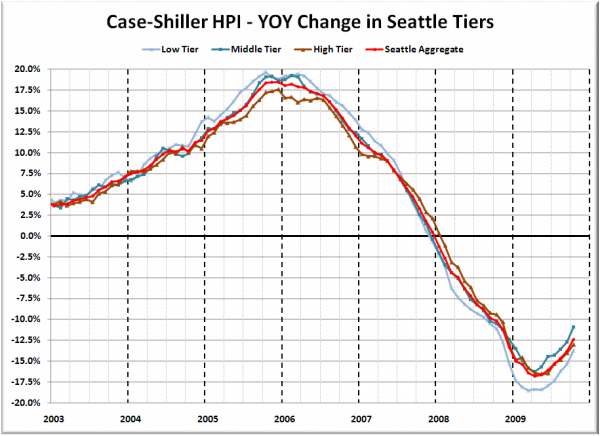
Here’s a chart of the year-over-year change in the index from January 2003 through October 2009.
The year-over-year situation improved slightly again in all three tiers, with the high tier again seeing the smallest bump. Here’s where the tiers sit YOY as of October – Low: -13.7%, Med: -10.9%, Hi: -13.0%.
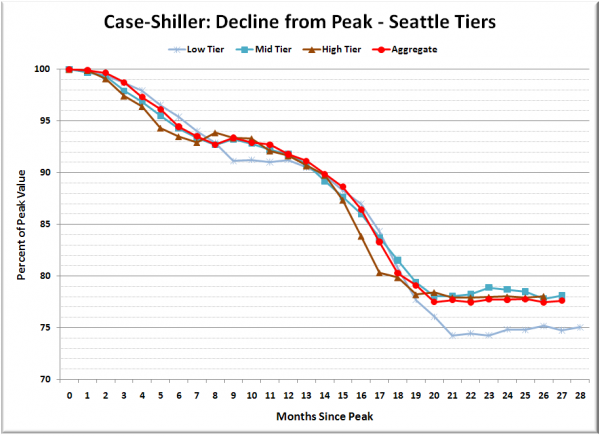
Lastly, here’s a decline-from-peak graph like the one posted yesterday, but looking only at the Seattle tiers.
If interest rates start to rise next year as most people are expecting them to, and the tax credit is truly allowed to expire, it will be interesting to see if this price plateau holds.
(Home Price Indices, Standard & Poor’s, 12.29.2009)


