Over in the open thread, a reader dropped a link to an amusing article from Forbes: No Double-Dip For Housing
Although the end of the Fed’s purchases will certainly not help the housing market, we do not believe it will result in a “double-dip” for housing or the economy. Instead, we expect home building, home sales and home prices to all be up a year from now vs. where they are today. Not on every street or in every community, but for the nation as a whole.
…we think the battered and bruised housing market is going to be in better shape one year from now than it is today.
When considering predictions from a publication, I think it is worthwhile to investigate how accurate their predictions have been in the past. To that end, I present this Forbes article, from June 2007 (one month before home prices peaked here in Seattle): Most Resilient U.S. Real Estate Markets
When it comes to real estate, the questions on everyone’s lips are: How low is low, and when’s the perfect time to buy back in?
That moment has passed in Seattle and Charlotte—both metros hit bottom in the first quarter of 2006 and have since posted price gains of 12.3% and 6.3%, respectively, according to National Association of Realtors (NAR) data.
Dang, I bet you feel like a chump for missing the Q1 2006 bottom here in Seattle, huh?
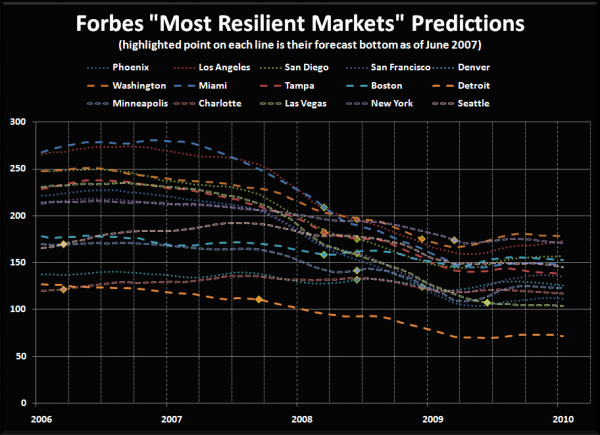
In the slideshow attached to the article, Forbes lists 19 markets that “stand the best chance of recovery” as well as predictions about “when the upturn will occur.” Plotted below are the fifteen markets from the slideshow or the article that are also tracked by Case-Shiller, with their forecast bottom marked with a yellow-outlined dot on each line.
Since the chart is a bit crowded, here are their bottom forecasts in table form. The first column is the quarter in which Forbes predicted the market would hit bottom, the second column is the quarter which has seen the lowest prices to date, and the third column is the percentage difference between the real bottom (so far) and the quarter that Forbes predicted would be the bottom. Click a column header to sort by that column.
| Market | Forbes | Actual* | Price Diff. |
|---|---|---|---|
| Phoenix | 2008-Q4 | 2009-Q2 | -16% |
| Los Angeles | 2008-Q2 | 2009-Q2 | -19% |
| San Diego | 2008-Q2 | 2009-Q2 | -18% |
| San Francisco | 2008-Q2 | 2009-Q1 | -26% |
| Denver | 2008-Q2 | 2009-Q1 | -9% |
| Washington | 2008-Q4 | 2009-Q1 | -5% |
| Miami | 2008-Q1 | 2009-Q2 | -31% |
| Tampa | 2008-Q1 | 2010-Q1 | -24% |
| Boston | 2008-Q1 | 2009-Q1 | -8% |
| Detroit | 2007-Q3 | 2009-Q2 | -37% |
| Minneapolis | 2008-Q2 | 2009-Q2 | -23% |
| Charlotte | 2006-Q1 | 2010-Q1 | -4% |
| Las Vegas | 2009-Q2 | 2010-Q1 | -3% |
| New York | 2009-Q1 | 2009-Q2 | -2% |
| Seattle | 2006-Q1 | 2010-Q1 | -14% |
On average, Forbes’ June 2007 bottom calls have been 17 months early, and prices have fallen 16% between their forecast bottom and the lowest post-peak price (to date). Their worst prediction in terms of price variance has been Detroit, where prices have fallen 37% since their “bottom.” Their closest guess was New York, where they were off by just one quarter and only 2%. Of course, then there’s Seattle and Charlotte, where prices are still hitting new lows in Q1 2010, despite Forbes’ hindsight call that they had hit bottom in Q1 2006.
In other words, Forbes’ predictions regarding the housing market have been about as accurate as a blindfolded, dart-throwing monkey.
So how much stock should we put in a prediction from Forbes that there will be “no double-dip for housing”? I’d say something close to zero.
