September market stats have been published by the NWMLS. Here’s what they have to say about their numbers: "Wise Buyers" Taking Advantage of Chance to Get Stellar Homes.
MLS director Pat Grimm, managing broker at Windermere RE/Capitol Hill in Seattle, reports an upsurge in people looking at properties, particularly move-up buyers. He attributes some of that activity to homes “finally being priced competitively.” The new pool of potential buyers are “getting their feet wet, but they’re taking their time before they jump in,” he commented.
…
“There are many very wise buyers taking advantage of what may be a once-in-a-lifetime opportunity,” said Mike Skahen, whose real estate career spans nearly 30 years. “We haven’t seen a summer like this in home sales since 1982 when interest rates were hovering around 16 percent,” he observed.Skahen, the owner and designated broker at Lake & Company Real Estate in Seattle and a member of the NWMLS board of directors, said the buyers they’re seeing have good jobs with Google and Amazon. “They realize they have the chance to get stellar homes in great locations at 25 percent off what they were selling for three years ago and at interest rates approaching 4 percent. I doubt you’ll see a market and selection better than right now,” he commented.
So, as long as you have a good job with Google or Amazon, homes around Seattle are easy to buy. Great.
NWMLS monthly reports include an undisclosed and varying number of
sales from previous months in their pending and closed sales statistics.
Here’s your King County SFH summary, with the arrows to show whether the year-over-year direction of each indicator is favorable or unfavorable news for buyers and sellers (green = favorable, red = unfavorable):
| September 2010 | Number | MOM | YOY | Buyers | Sellers |
|---|---|---|---|---|---|
| Active Listings | 10,390 | -1.5% | +9.3% |  |
 |
| Closed Sales | 1,158 | -11.8% | -28.4% |  |
 |
| SAAS (?) | 2.75 | +22.2% | +51.2% |  |
 |
| Pending Sales | 1,772 | -0.2% | -22.6% |  |
 |
| Months of Supply | 5.77 | -1.3% | +41.2% |  |
 |
| Median Price* | $379,950 | 0.0% | -0.6% |  |
 |
Feel free to download the updated Seattle Bubble Spreadsheet (Excel 2003 format), but keep in mind the caution above.
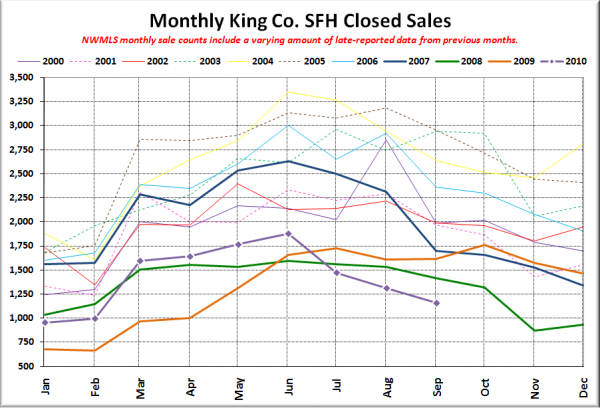
Here’s your closed sales yearly comparison chart:
Closed sales have been turning in the worst numbers in over 10 years for three months in a row now.
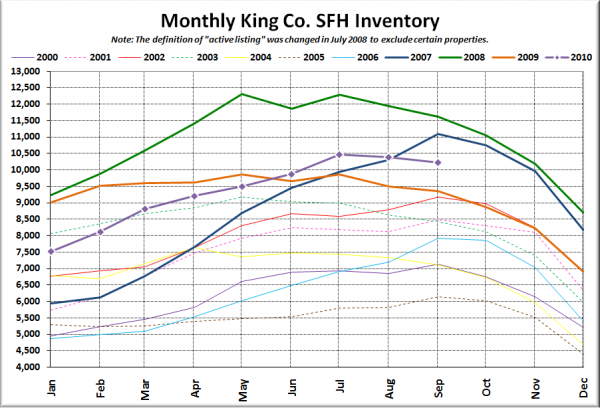
Here’s the graph of inventory with each year overlaid on the same chart.
Definitely doesn’t look like we’ll break 11,000. However, it looks like we’ll probably stay above last year’s levels through the end of the year at this pace.
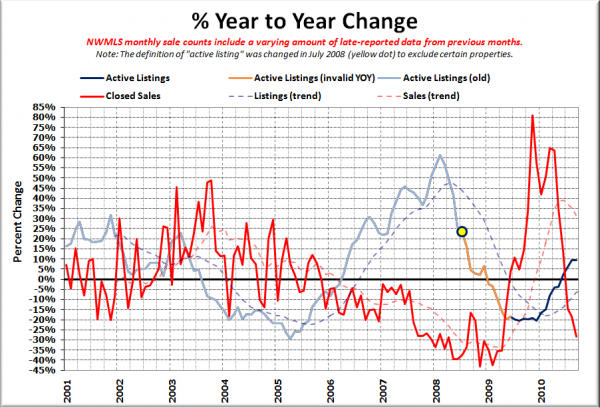
Here’s the supply/demand YOY graph. In place of the now-unreliable measure of pending sales, the “demand” in this chart is represented by closed sales, which have had a consistent definition throughout the decade.
Pretty strongly in “buyer’s market” territory when you look at supply and demand.
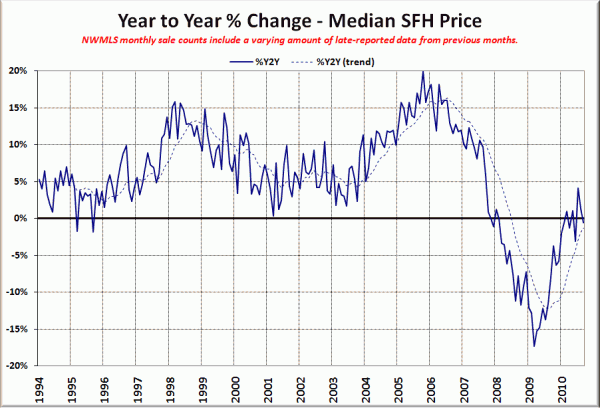
Here’s the median home price YOY change graph:
Oops, dipped back below zero there.
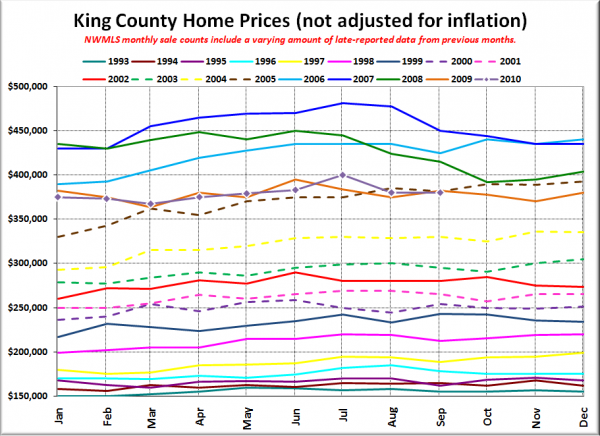
And lastly, here is the chart comparing King County SFH prices each month for every year back to 1994.
September is like some sort of confluence or something. 2005: $381,250 2009: $382,160 2010: $379,950.
Here are the blurbs from the Seattle Times and P-I:
Seattle Times: King County home sales dry up with tax credit
Seattle P-I: Seattle housing market grinding to a halt
Check back tomorrow for the reporting roundup.
