October market stats have been published by the NWMLS. Here’s their press release: Housing Activity Remained Sluggish During October; Market Change Not Likely to be "Light Switch" Moment.
Housing activity around Washington state remained lackluster during October, with brokers reporting year-over-year declines in pending sales. On a brighter note, prices on sales that closed last month showed signs of stabilizing, with eight counties showing price gains compared to 12 months ago.
“The change in the market will not be a ‘light switch’ moment,” remarked NWMLS director Frank Wilson, branch managing broker at John L. Scott Real Estate in Poulsbo. He expects 2011 will be a little better than 2010, with 2012 likely to be a little better than 2011.
…
“Buyers and sellers need to live in the now and not try to second-guess the market or when it will actually bottom out,” Wilson suggested, adding the messages to sellers and buyers are unchanged.
Got it? Only real estate professionals are allowed to make wild guesses about the market bottom.
Let’s have a look at their stats, shall we?
NWMLS monthly reports include an undisclosed and varying number of
sales from previous months in their pending and closed sales statistics.
Here’s your King County SFH summary, with the arrows to show whether the year-over-year direction of each indicator is favorable or unfavorable news for buyers and sellers (green = favorable, red = unfavorable):
| October 2010 | Number | MOM | YOY | Buyers | Sellers |
|---|---|---|---|---|---|
| Active Listings | 9,674 | -5.4% | +9.1% |  |
 |
| Closed Sales | 1,309 | +13.0% | -25.5% |  |
 |
| SAAS (?) | 2.04 | -17.1% | +26.2% |  |
 |
| Pending Sales | 1,811 | +2.2% | -21.1% |  |
 |
| Months of Supply | 5.34 | -7.5% | +38.2% |  |
 |
| Median Price* | $375,000 | -1.3% | -0.7% |  |
 |
Feel free to download the updated Seattle Bubble Spreadsheet (Excel 2003 format), but keep in mind the caution above.
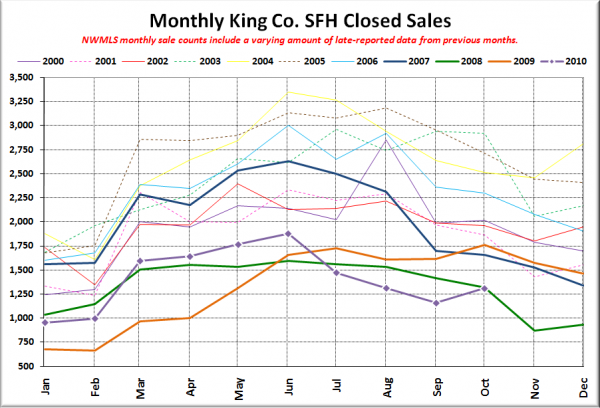
Here’s your closed sales yearly comparison chart:
Note that October’s uptick is probably more likely a result of NWMLS reporting errors than an actual increase in the number of sales as we head into the fall.
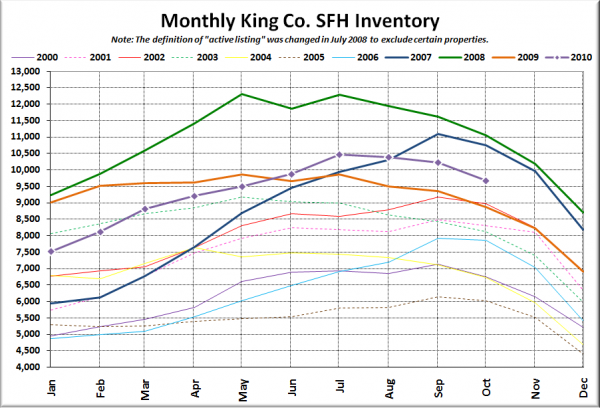
Here’s the graph of inventory with each year overlaid on the same chart.
Still tracking above last year, but well below the record highs of 2008 and 2007.
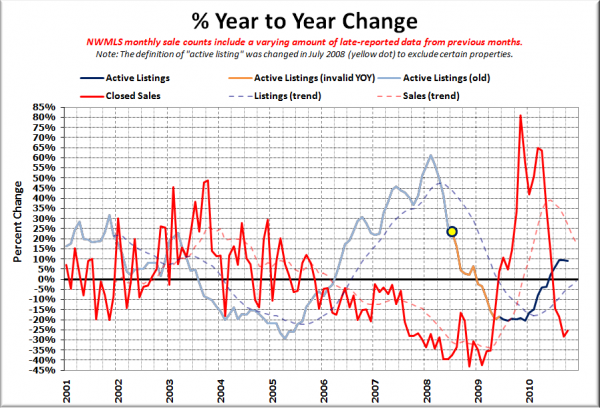
Here’s the supply/demand YOY graph. In place of the now-unreliable measure of pending sales, the “demand” in this chart is represented by closed sales, which have had a consistent definition throughout the decade.
Still firmly in “buyer’s market” territory.
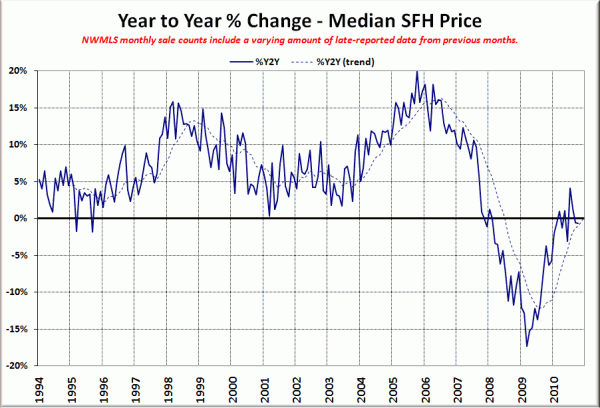
Here’s the median home price YOY change graph:
Still just below zero.
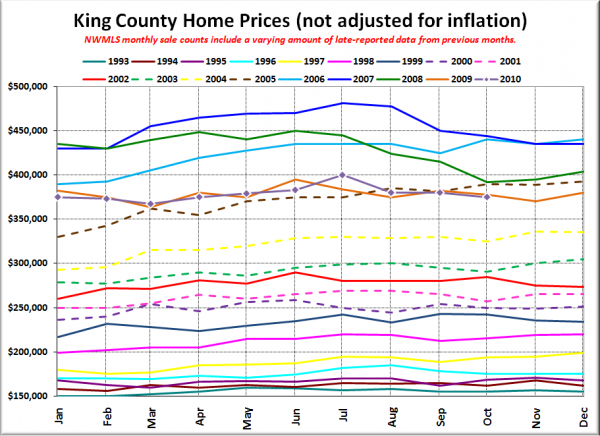
And lastly, here is the chart comparing King County SFH prices each month for every year back to 1994.
Uh-oh, slipping back below 2005 levels there. October 2005: $390,000. October 2010: $375,000.
No blurbs yet from the Seattle Times and P-I. Check back tomorrow, when their reporting will be included in the full reporting roundup.
