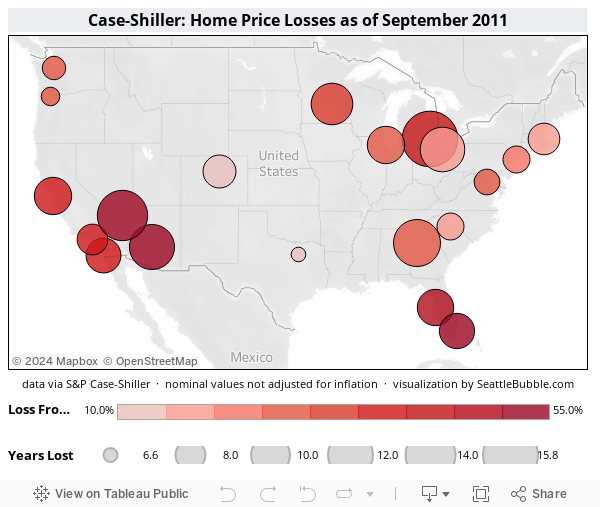
I thought it would be interesting to post one more viz on the latest Case-Shiller numbers. This time I’ve put the data from all twenty cities on a map. The size of each circle represents how far back prices have rewound (larger = further back), and the circles are color-coded by how much prices have lost from their peak value. Float over a circle for the details about that city.
Here’s what the National Association of REALTORS had to say about national housing bubbles just a few years ago:
Has there ever been a national housing price bubble? No.
How long have home prices declined in the past?
Although there are exceptions to any general finding, most metro areas that experienced price declines were relatively short lived (several years). … Very few people buy at the top of a market and then sell in a short timeframe. After several years, home prices level and return to normal appreciation patterns.
Note that every city tracked by Case-Shiller sits at a home price level lower than when that NAR document was published in 2005. Oops.
Of course, it could be worse. You could be the guy that wrote a cocky “21 reasons to bank on the Phoenix real estate market” blog post in July 2006, just one month after prices peaked there.
HousingPanic, a particularly vitriolic BubbleBlog — which is saying something — asks:
Realistically, how overvalued are Phoenix home prices?Obviously, I consider this a profoundly silly question…
…We keep our own home sales price statistics, so we have no doubt that values are down from their high in December. How much? Right now, about 4%. Could they go lower? Certainly. Will they drop by the huge amounts HousingPanic and his flying monkeys seem to yearn for? This seems very unlikely.
What seems much more likely is that Phoenix will recover from the hangover of last year’s buying binge and get back to a steady rate of growth — historically 6% a year.
Here’s the especially amusing part. In the July 2006 HousingPanic post linked to by this esteemed Phoenix real estate professional, it was suggested that Phoenix home prices may be overvalued by as much as 50%. Note in the map above that Phoenix home prices are down 55% from their June 2006 peak (so far).
Oops.