After spending a couple days looking at incomes and home prices, let’s throw interest rates into the mix as well with an updated look at affordability.
As a brief refresher, here’s the formula for calculating the affordability index:
While we discuss the broad county-wide affordability trends, don’t forget that you can also play around with the Simple Affordability Calculator I built to calculate your personal affordability scenario.
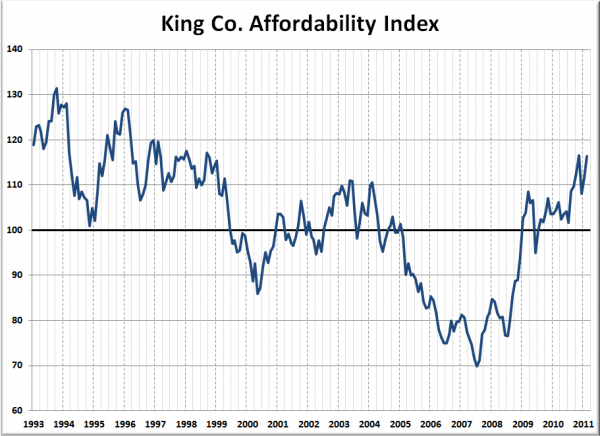
Here’s a look at King County’s affordability index over the last 18 years (as far back as the median price data from the NWMLS is available):
The average level of the affordability index from 1993 through 2004 was 108.3. The latest reading was 116.4. Whoa—that’s higher than any level we’ve seen since 1998!
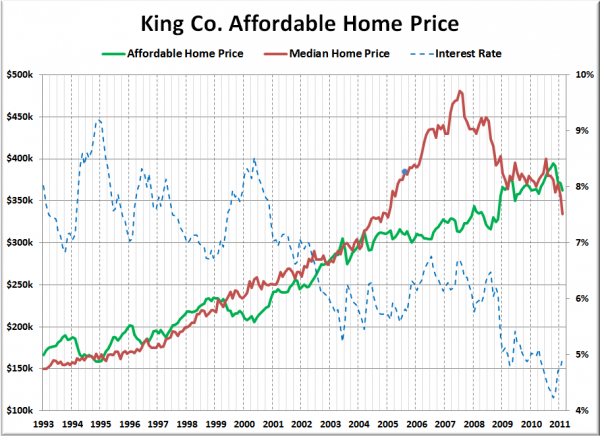
Since the affordability index is fairly abstract, let’s have another look at my favorite affordability chart, where we compare how much home 30% of the median household income could buy with how much the median house is selling for each month:
Wow, thanks to today’s still super-low interest rates, the affordable price for the median household income is actually $29,000 higher than the median home price.
The blue dot on the red line above represents the month this blog was started, August 2005. At that time, the median home price was 24% more expensive than what the median household income could afford. The difference between the two topped out at 54% in July 2007.
From 1993 through 2004, median prices came in an average of 0.4% lower than what the median household income could afford. The latest reading puts the affordable home price 7.9% lower than the median home price. That’s not the lowest point on record (that was 18.5% in October 1993), but it is the best affordability we’ve seen since September 1998.
As I mentioned, interest rates are still a huge factor keeping affordability high. February’s average rate for a 30-year mortgage came in at 4.95%. At an interest rate of 6.5% (0.7 points below the ’93-’04 average), the affordability index would currently sit at a much lower (but still not terrible) 98.3.
So what does this tell us? It would appear that although home prices got out of whack with median household incomes before the housing bubble started, the combination of post-bubble pricing and today’s abnormally low interest rates are actually making King County homes more affordable than they have been any time since before the dot-com boom.
Does this mean that home prices are at bottom? Probably not quite, since most busts tend to over-correct, and we’ve still got quite a few negative economic factors hanging over our heads in combination with a growing sentiment that homebuying is only for suckers. However, as I noted when I compared home prices to per capita incomes on Monday, it’s absolutely noteworthy, and could be a sign that we’re at least getting close to the bottom.


