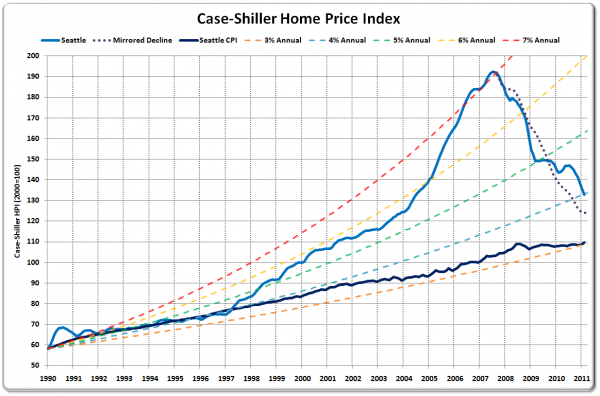
I updated my chart that compares the gains in Seattle’s Case-Shiller Home Price Index with consistent annual increases at various levels, and noticed that for the first time since 1997, home prices dropped below the level of 4% annual gains since 1990.
I’ve also added a plot of the Consumer Price Index for the Seattle metro area from the BLS on there for comparison. Local inflation has pretty much tracked between 3% and 4% annually since 1990, and home prices are still pretty far ahead of where they would be if they were just tracking inflation.
I would argue that Seattle is a very different place than it was in 1990, so I’m not sure that we’ll ever quite get all the way back down to the inflation line that we departed from in 1997. The housing bubble was an obvious, dramatic deviation from a level of home price growth that could be described in any way as sensible, but it isn’t clear to me that it’s reasonable to expect home prices in a growing metro area to only track inflation in perpetuity.
However, this chart certainly provides ammunition for those that argue that the real beginning of the housing bubble was in 1997, and we still have a long ways yet to fall. As of February, Seattle’s Case-Shiller HPI is 21% higher than Seattle’s Consumer Price Index (re-indexed to match the CS-HPI in January 1990).
