August market stats were published by the NWMLS this afternoon. Here’s their press release: Northwest MLS brokers notch this year’s best monthly tally of sales during August
“For the first time in a long time, I can say with confidence that things feel better,” said Northwest MLS director OB Jacobi, president of Windermere Real Estate. “We shouldn’t get too distracted by the large increase in pending sales,” he cautioned, noting, “It’s a positive sign, but these figures are being compared to last summer’s post-tax incentive doldrums. With that being said, we’re excited about the positive momentum in the market.”
…
Commenting on the latest numbers, NWMLS director Frank Wilson emphasized, “A real estate market is about activity and momentum.” He also noted historic affordability, with the cost of a home better matching income levels and extremely low interest rates contributing to favorable conditions. “We continue to live in a real estate market of extreme affordability, affordability levels that have not been seen in decades,” he stated.
We’ll wait until tomorrow’s reporting roundup to comment on their press release. For now let’s get to the stats.
NWMLS monthly reports include an undisclosed and varying number of
sales from previous months in their pending and closed sales statistics.
Here’s your King County SFH summary, with the arrows to show whether the year-over-year direction of each indicator is favorable or unfavorable news for buyers and sellers (green = favorable, red = unfavorable):
| August 2011 | Number | MOM | YOY | Buyers | Sellers |
|---|---|---|---|---|---|
| Active Listings | 7,995 | -2.3% | -23.1% |  |
 |
| Closed Sales | 1,775 | -5.8% | +35.2% |  |
 |
| SAAS (?) | 1.42 | -20.2% | -36.9% |  |
 |
| Pending Sales | 2,329 | +1.4% | +31.1% |  |
 |
| Months of Supply | 3.43 | -3.7% | -41.3% |  |
 |
| Median Price* | $350,000 | 0.0% | -7.9% |  |
 |
Feel free to download the updated Seattle Bubble Spreadsheet (Excel 2003 format), but keep in mind the caution above.
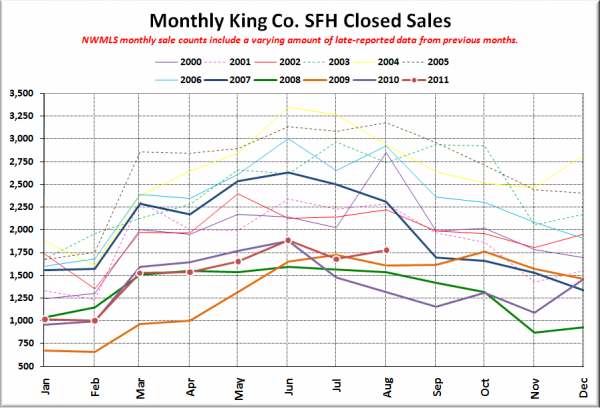
Here’s your closed sales yearly comparison chart:
Definitely a divergent path compared to the last four years. The last year that closed sales increased between July and August was 2006, when we were still in the midst of the bubble. Of course, when you compare the actual volume of closed sales this August to any year other than the last three years, it still looks pretty dismal.
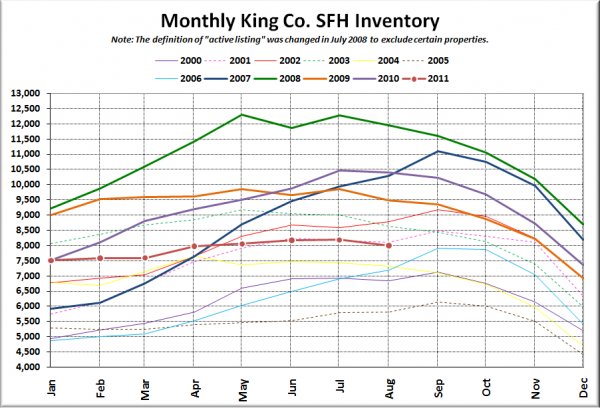
Here’s the graph of inventory with each year overlaid on the same chart.
Looks like we’re heading down for the winter about two months earlier than typical years.
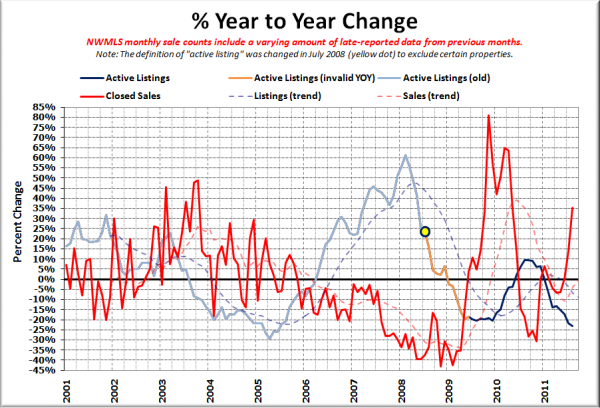
Here’s the supply/demand YOY graph. In place of the now-unreliable measure of pending sales, the “demand” in this chart is represented by closed sales, which have had a consistent definition throughout the decade.
Sales are still pretty wonky on here thanks to last year’s expiration of the tax credit, and my guess is that inventory is heading down because most of the stupidly optimistic sellers have finally gotten the message that they really can’t get bubble prices for their homes anymore, so they’ve given up listing entirely.
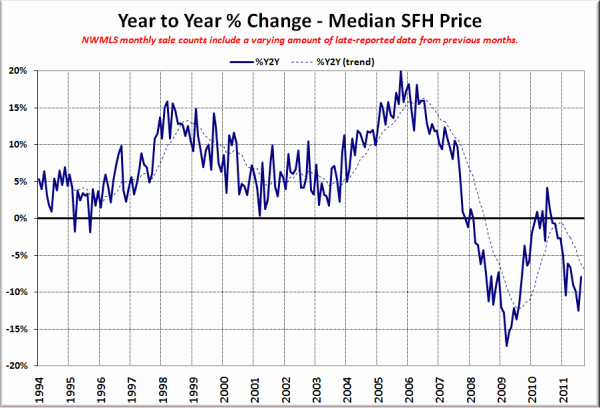
Here’s the median home price YOY change graph:
Slight improvement over last month, but still firmly in negative territory here.
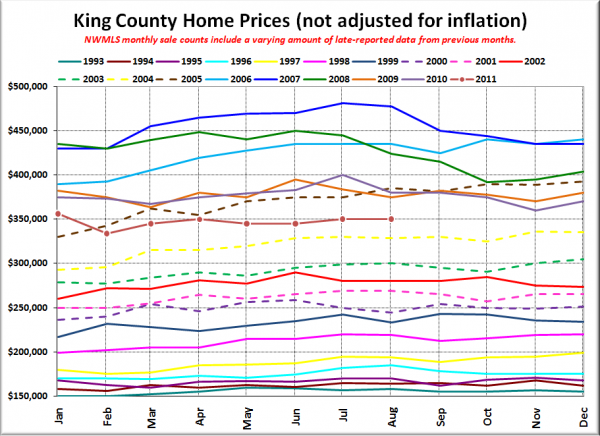
And lastly, here is the chart comparing King County SFH prices each month for every year back to 1994.
August 2011: $350,000
April 2005: $355,000
Here are the headlines from the Seattle Times and the Seattle P-I. Check back tomorrow for the full reporting roundup.
Seattle Times: Local home sales on an upswing
Seattle P-I: Home sales surged in August, while prices fell
(Wow, “surged”? Really?)
