November market stats were published by the NWMLS this afternoon. Here’s their press release: Home sales outpace number of new listings for first time in five years
Last month’s total number of mutually accepted offers was 22.4 percent higher than the same month a year ago. It also marked the first month since December 2006 that the number of pending sales surpassed the number of new listings (6,043), prompting discussions of possible inventory shortages.
Considering the fact that the NWMLS changed their definition of what counts as a “pending sale” in July 2008 to inflate the numbers (details here), I fail to see how this is a headline-worthy acheivement.
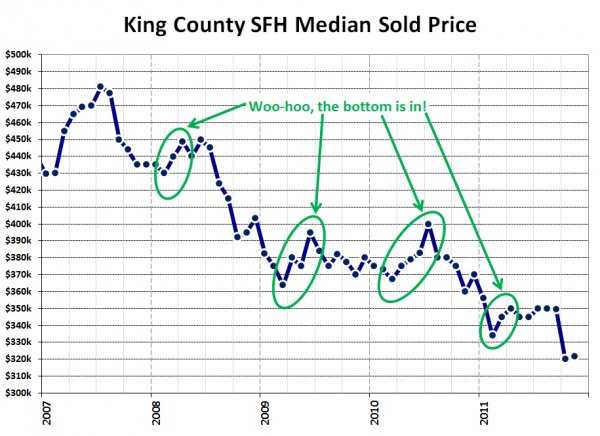
Meanwhile, prices ticked up 0.5% from October to November, so the bottom must be in! …right?
Okay, on with the stats!
NWMLS monthly reports include an undisclosed and varying number of
sales from previous months in their pending and closed sales statistics.
Here’s your King County SFH summary, with the arrows to show whether the year-over-year direction of each indicator is favorable or unfavorable news for buyers and sellers (green = favorable, red = unfavorable):
| November 2011 | Number | MOM | YOY | Buyers | Sellers |
|---|---|---|---|---|---|
| Active Listings | 6,487 | -9.6% | -25.6% |  |
 |
| Closed Sales | 1,538 | +3.3% | +40.8% |  |
 |
| SAAS (?) | 1.35 | -8.6% | -34.7% |  |
 |
| Pending Sales | 1,925 | -11.1% | +18.2% |  |
 |
| Months of Supply | 3.37 | +1.7% | -37.1% |  |
 |
| Median Price* | $321,700 | +0.5% | -10.6% |  |
 |
Feel free to download the updated Seattle Bubble Spreadsheet (Excel 2003 format), but keep in mind the caution above.
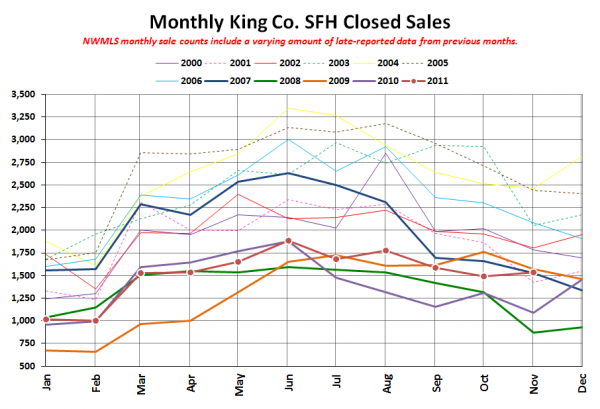
Here’s your closed sales yearly comparison chart:
Slight uptick from October to November, which is rather unusual. I’m betting it’s due to shifty NWMLS accounting and we see it drop hard next month.
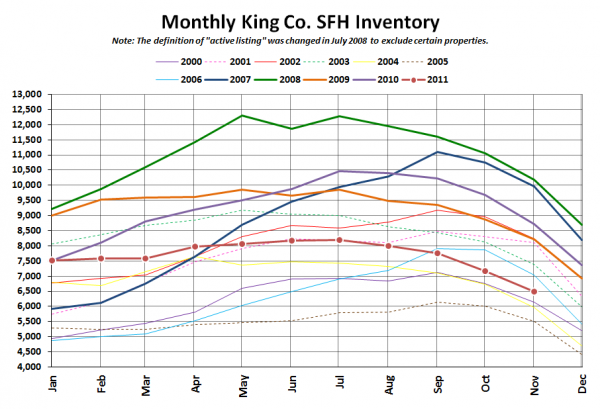
Here’s the graph of inventory with each year overlaid on the same chart.
Same old story there.
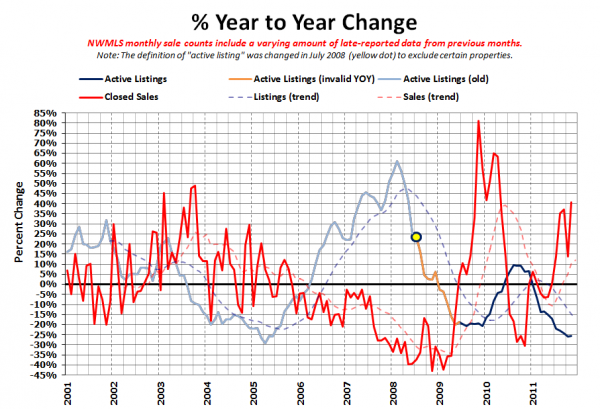
Here’s the supply/demand YOY graph. In place of the now-unreliable measure of pending sales, the “demand” in this chart is represented by closed sales, which have had a consistent definition throughout the decade.
Same thing we’ve seen all year. Increasing sales, decreasing inventory. And yet prices keep falling…
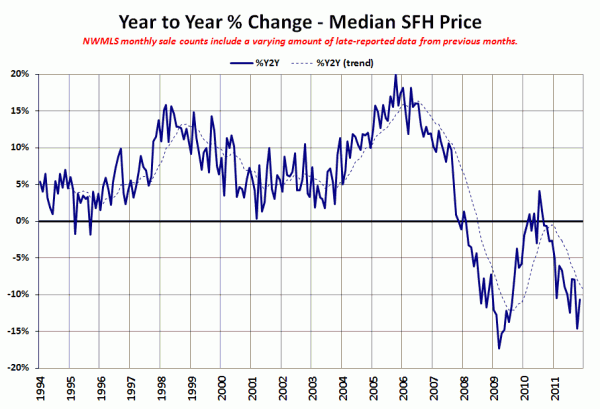
Here’s the median home price YOY change graph:
An uptick, but still below -10%.
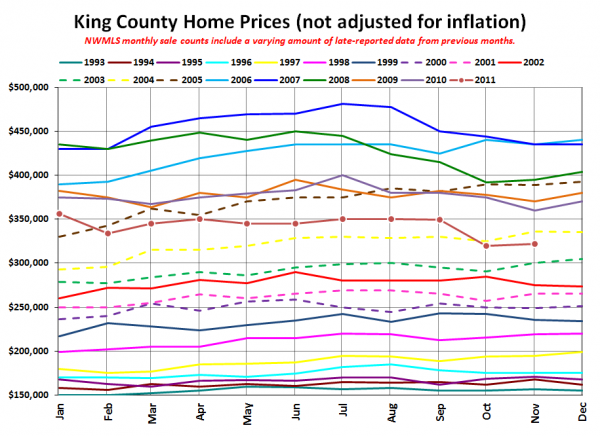
And lastly, here is the chart comparing King County SFH prices each month for every year back to 1994.
November 2011: $321,700
May 2004: $320,000
Here’s the headlines from the Times (no story on the P-I yet):
Seattle Times: King County median home price drops 11 percent in November from year ago
Check back tomorrow for the full reporting roundup.
