A commenter brought up an interesting point over the weekend:
I thought Case-Shiller showed that over time dwellings gained nothing more than inflation.
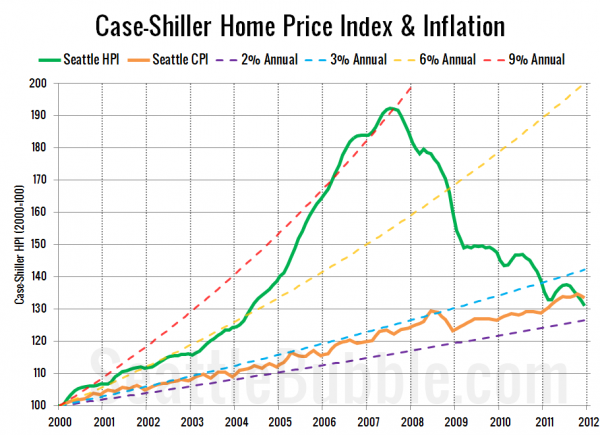
Let’s see how Seattle’s Case-Shiller index has performed compared to inflation since 2000. In the chart below I’ve plotted Seattle’s Case-Shiller Home Price Index (which comes from the factory indexed to January 2000 = 100) next to the Bureal of Labor Statistics’ Consumer Price Index (less shelter) for the Seattle area, re-indexed to match Case-Shiller’s January 2000 = 100.
[Note: I updated the chart above to include the data released the day after this was posted.]
Surprisingly (to me, anyway) Seattle-area home prices have actually been outpaced by inflation over the 12-year period since 2000.
Local inflation has mostly trended fairly close to the 3% per year line, save for some brief deflation during the 2008 financial crisis. Meanwhile, home prices were trending along the 6% per year line for four years before things really got out of control, shooting them up above the 9% per year since 2000 line in 2006 and 2007.
Since the bursting of the bubble, home prices have blown past the 6% per year line, all the way down through the 3% per year line, and as of October, below Seattle’s inflation since 2000.
Does this mean that every home around Seattle is now a good deal? Nope. Does it mean that prices can’t fall further? Also nope. But in my opinion, it does mean that the vast majority of the excesses of the housing bubble have now been cleared out.
