At the risk of getting a little too technical and going off the quant deep end, I wanted to explore a different view of the Case-Shiller home price data that I haven’t shared on here before.
Typically when we look at the Case-Shiller home price data on here, we look at three things: The raw value (like change from peak, etc.), the year-over-year change, and to a lesser extent, the month-over-month change. Something we talk about occasionally but have never actually charted is the rate of change in the year-over-year change—the second derivative.
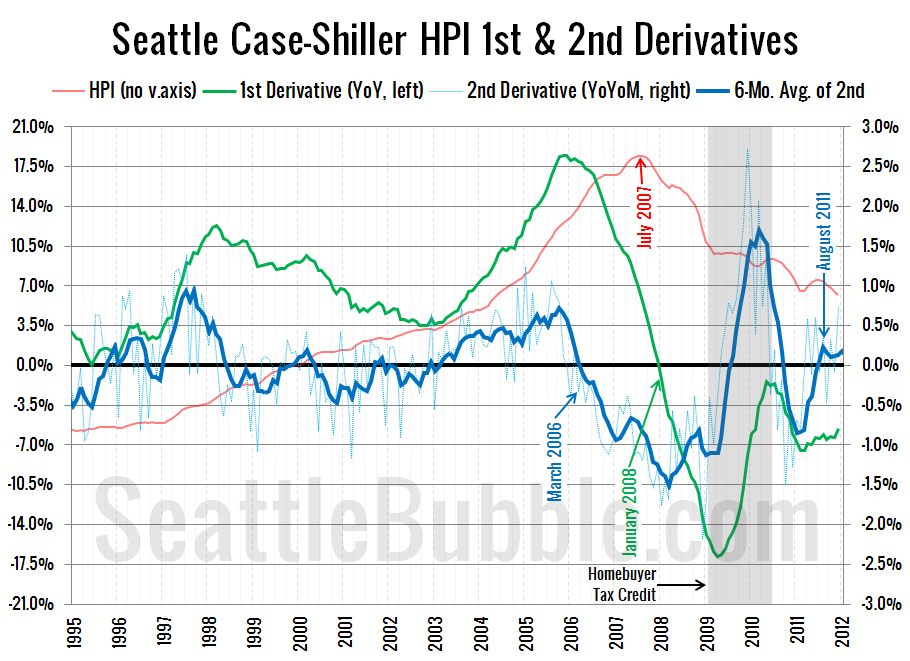
Here’s what that chart looks like:
Personally, I find this chart to be quite fascinating. I’ve annotated a few interesting dates of note:
- March 2006: 2nd derivative passes into negative territory and stays there.
- July 2007: Home prices peak (16 months after the 2nd derivative went negative).
- January 2008: 1st derivative passes into negative territory (6 months after home prices peak).
- August 2011: 2nd derivative passes into positive territory.
If price movement were to follow roughly the same trend that we saw on the way down, this data would imply a bottom in home prices this coming December.
I think it’s also worth noting that even before the tax credit was passed, the 2nd derivative had bottomed and had been heading back up for about a year. I find it quite interesting to see just how much the tax credit distorted the steady recovery that was already underway, shooting the 2nd derivative through the roof, only to have it collapse again, overshooting the trend that had been established pre-credit.
Before the bust, the 2nd derivative peaked in August 2005, nearly a full two years before home prices peaked. The bottom in the 2nd derivative came in December 2008 (there’s a spike down that’s hard to see unless you enlarge the image), but as I’ve mentioned before, the tax credit basically put real recovery on hold for its sixteen-month reign, so if we add two years plus sixteen months to the bottom in the 2nd derivative, we come up with a bottom for home prices right around the corner in April 2012.
Obviously this is not a rigorous, in-depth, multi-factor economic analysis. I’m not making any solid predictions based on this data, but I do think that the trends are pretty clearly heading in a direction that suggests price stabilization soon.

