March market stats were released by the NWMLS late yesterday. Here’s their press release:
“Buyer Ready” Home Shoppers Have Edge as Brokers Report Rise in Multiple Offers.
The housing market in the Puget Sound region is pointing toward a sustainable recovery, according to several brokers who commented on the March activity report from Northwest Multiple Listing Service.
…
“We are seeing a frenzied market in the Puget Sound region, especially in the more affordable and mid-price ranges, with an increase in sales activity in the high end,” remarked J. Lennox Scott, chairman and CEO of John L. Scott Real Estate. “Because of the shortage of homes for sale, combined with the sales surge being driven by job growth and historically low interest rates, if you are not ‘buyer ready’ you may not get a house in today’s market,” he added.
…
Noting stabilizing prices are “forcing buyers to make offers that reflect a more balanced market,” Northwest MLS director Darin Stenvers said house-hunters have taken note of rising rents, fewer choices and increasing fuel costs.”
I told you that this gas prices nonsense would rear its head again. In other news… It’s a FRENZY! You know it has to be true because Pyramid Expert J. Lennox Scott says so!
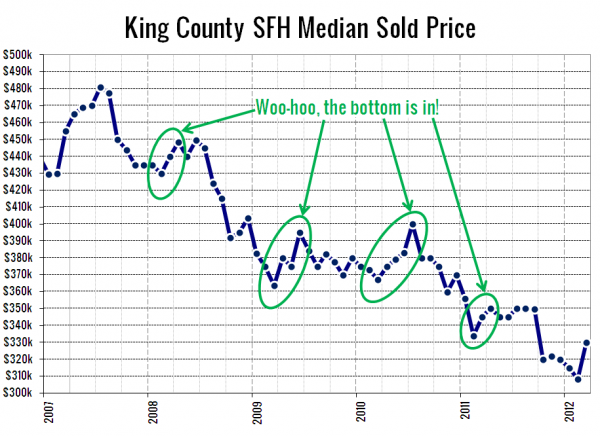
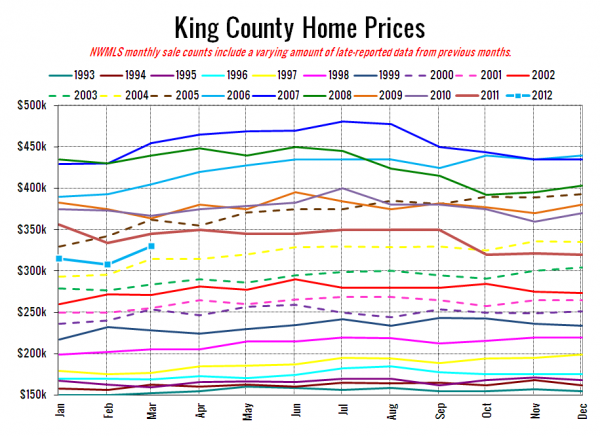
Before you get too worked up about the biggest February to March median price increase on record (previous high was a 6.4% gain in 2004), remember that prices have jumped up in a similar manner every spring throughout the downturn (albeit not as large):
With that, let’s get on with the stats!
NWMLS monthly reports include an undisclosed and varying number of
sales from previous months in their pending and closed sales statistics.
Here’s your King County SFH summary, with the arrows to show whether the year-over-year direction of each indicator is favorable or unfavorable news for buyers and sellers (green = favorable, red = unfavorable):
| March 2012 | Number | MOM | YOY | Buyers | Sellers |
|---|---|---|---|---|---|
| Active Listings | 4,978 | -3.9% | -34.4% |  |
 |
| Closed Sales | 1,642 | +33.5% | +7.7% |  |
 |
| SAAS (?) | 1.51 | +3.3% | -11.9% |  |
 |
| Pending Sales | 3,018 | +24.2% | +23.9% |  |
 |
| Months of Supply | 1.65 | -22.6% | -47.1% |  |
 |
| Median Price* | $330,000 | +7.1% | -4.3% |  |
 |
Feel free to download the updated Seattle Bubble Spreadsheet (Excel 2003 format), but keep in mind the caution above.
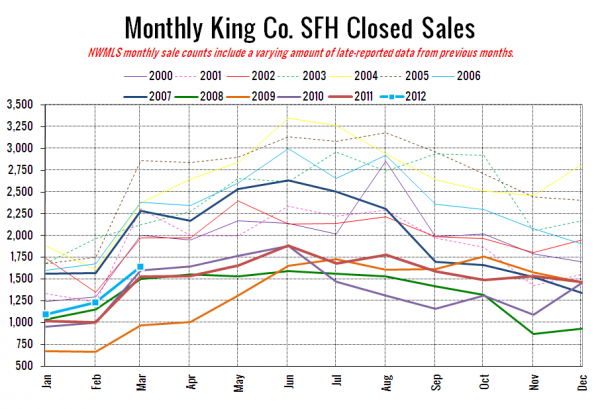
Here’s your closed sales yearly comparison chart:
Just the usual seasonal bump in sales, nothing to write home about, especially since they’re still quite a bit below every year before 2007. Just like our monthly stats preview predicted, the big year-over-year gain from February mostly vanished in March, dropping from over 22% to under 8%.
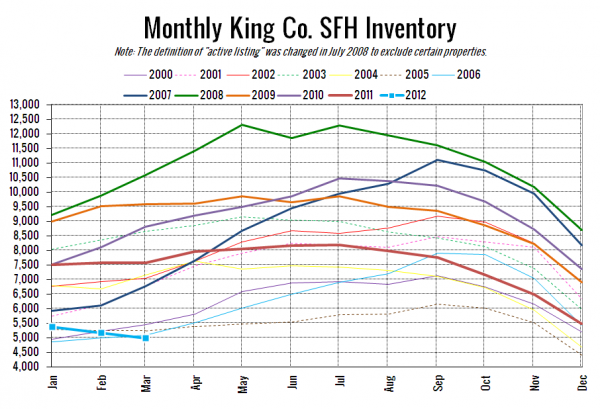
Here’s the graph of inventory with each year overlaid on the same chart.
And we are now at an all-time low for March. Previous record was in 2006 when there were just 5,100 homes on the market. However, keep in mind that the NWMLS did change the definition of “active listing” between then and now, so it’s not apples to apples.
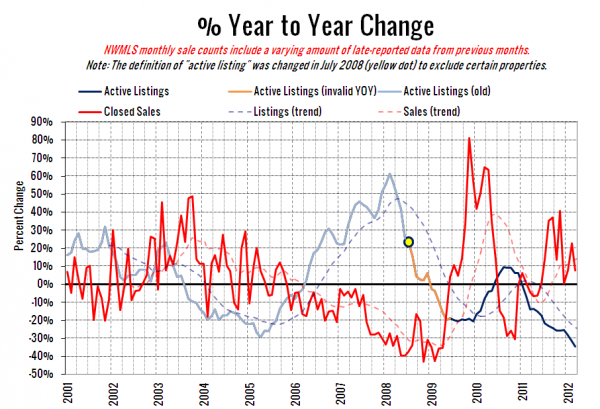
Here’s the supply/demand YOY graph. In place of the now-unreliable measure of pending sales, the “demand” in this chart is represented by closed sales, which have had a consistent definition throughout the decade.
Sales gains dropped off, but the steep drop in inventory just gets deeper.
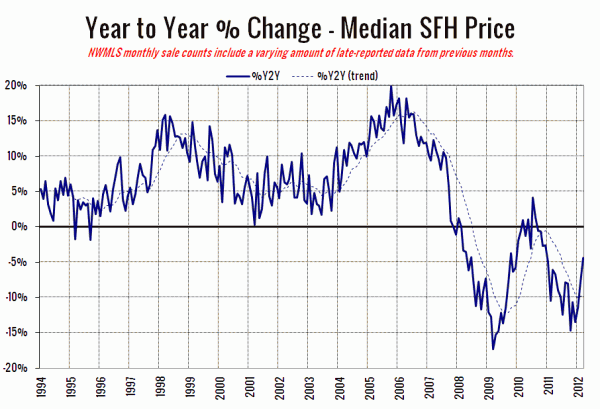
Here’s the median home price YOY change graph:
Another upward tick toward zero…
And lastly, here is the chart comparing King County SFH prices each month for every year back to 1994.
March 2012: $330,000
July 2004: $329,950
Here are the headlines from the Seattle Times and the Seattle P-I:
Seattle Times: King County home prices highest since September
Seattle P-I: Seattle house prices up again
Check back Monday for the full reporting roundup.
