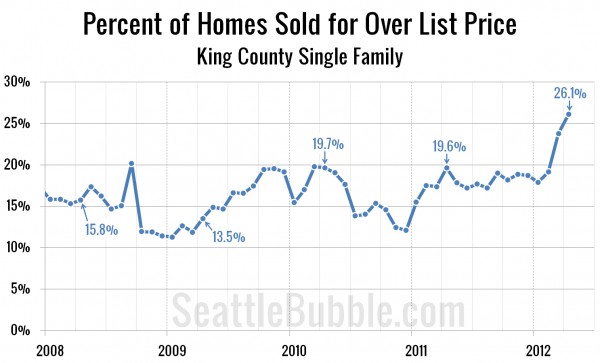
We’ve been hearing a lot about how much hotter this spring has been than spring in other recent years, and the stories of “bidding wars” seem to be getting a lot more frequent. I decided to see if we could visualize this trend by plotting the percentage of houses that sell for over their list price each month.
I have reliable detailed sales data for King County back through 2008, so here’s the last 4+ years of that measure, with April’s number highlighted in each year:
Yikes. That’s quite the ramp-up in 2012, easily dwarfing every other post-boom year, with April 2012 coming in 6.5 percentage points higher than April 2011.
Just another sign that we may in fact have finally, really, hit the bottom.
