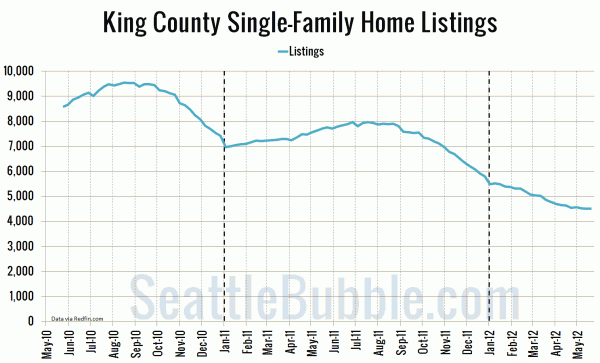
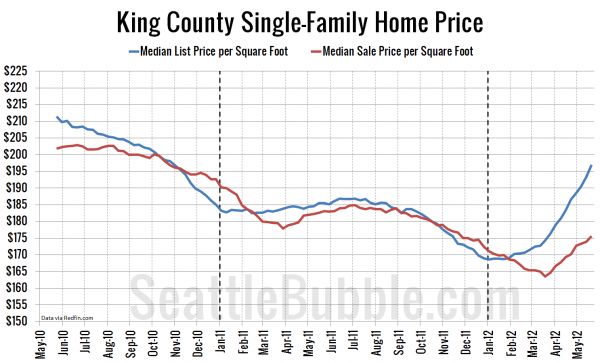
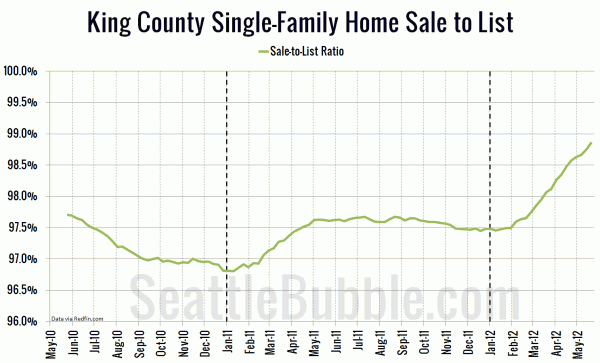
In order to quantify just how absurd this year’s spring bounce has been, here are a few charts I generated from the single-family home data on Redfin’s region page for King County:
Listings continue to drop through the floor. The selection this year really is abysmal.
Meanwhile, listing prices are soaring through the roof. They tend to spike every spring, but the spring bounce in 2012 has shot the median list price per square foot to its highest point since November 2010, easily surpassing all of 2011 in just a couple months. Sale prices haven’t seen quite as much of a boost, but the upward trend there is clear as well, just on a slight delay.
Where things will really get interesting is a little later this year. Throughout the bust, prices have tended to peak sometime between June and August, then just headed south again for the winter, plunging to a new low before the year is out. Will the same pattern emerge in 2012? Time will tell…
This one is interesting when coupled with the soaring list prices in the previous chart. Even though prices are shooting up, the sale to list ratio is rapidly approaching 100%.
All of these trends are mirrored in Snohomish County, Pierce County, and Seattle proper. The average sale to list ratio in Snohomish County is actually over 99%, and Seattle is at 99.7%.
Whether this is the “bottom” or not, it’s certainly the biggest “spring bounce” we’ve seen in years, by far. Not an especially fun time to be a home buyer.
Full disclosure: The Tim is employed by Redfin.


