Full disclosure: The Tim is employed by Redfin.
It’s been quite a while since I’ve posted any of the monthly market stats published by my employer, but since I’ve been spending a lot more time than usual knee-deep in these spreadsheets lately, I thought I’d share a few charts from the May update (xls).
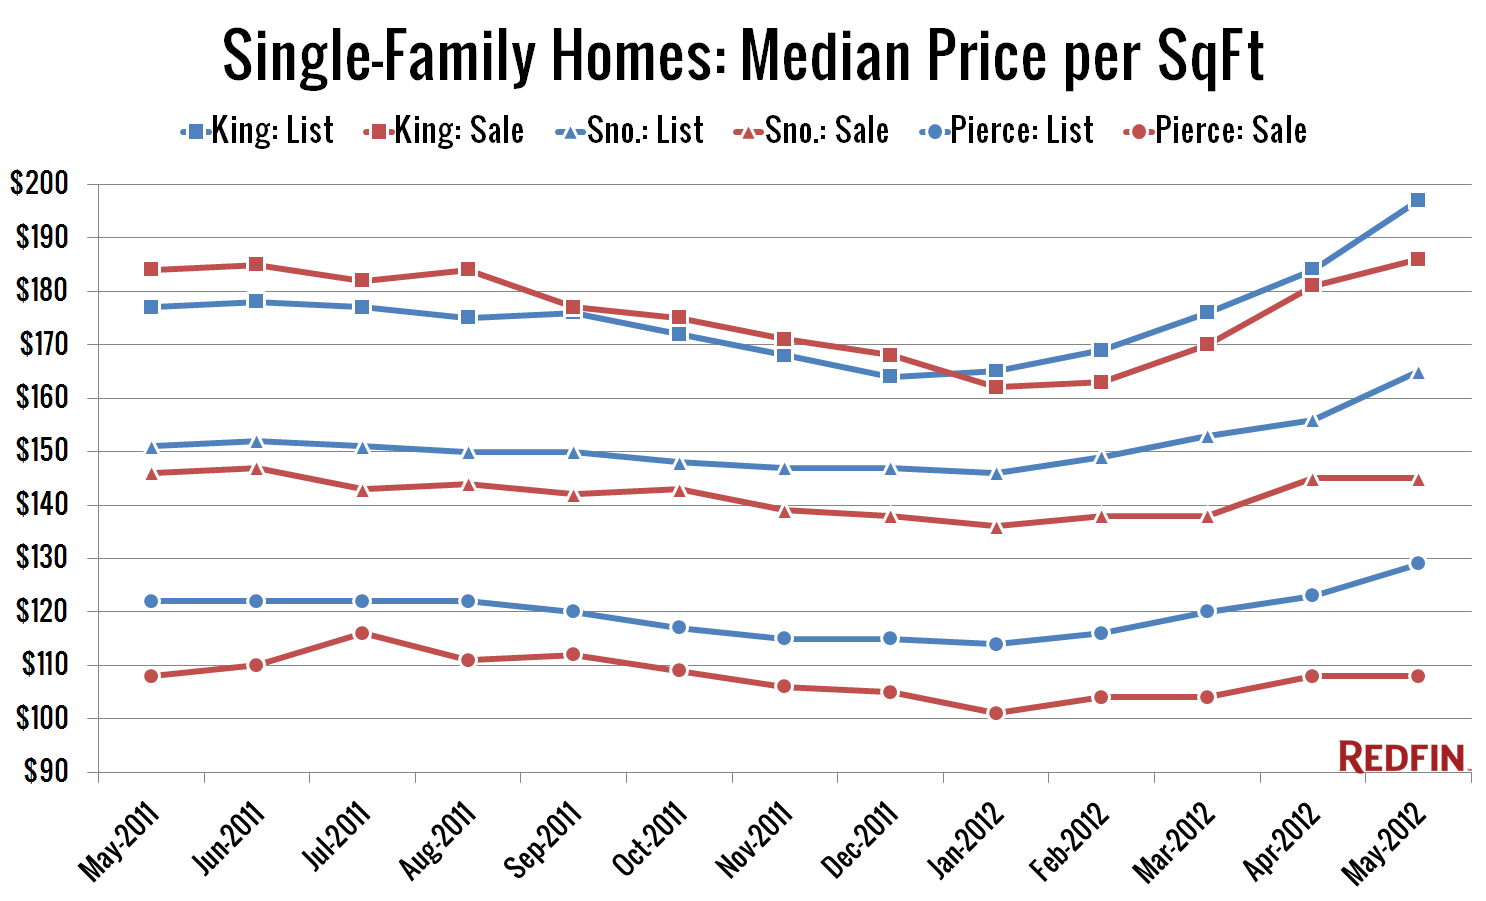
First up, here’s median price per square foot, both for listings and sales, for King, Snohomish, and Pierce Counties:
All three counties are basically moving in tandem on the price front, with listing prices and sale prices both on the rise since January. Snohomish and Pierce showed some signs of slowing, turning flat in May, but King County turned in another increase, gaining 2.8% month-over-month.
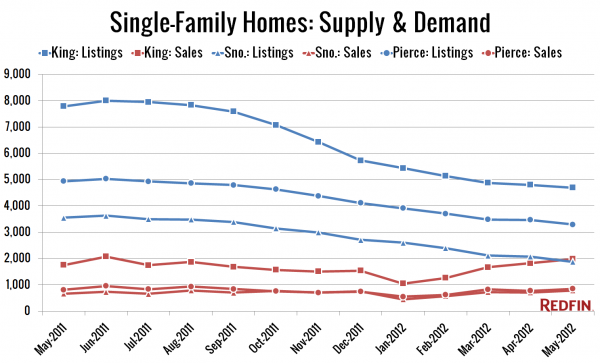
Next up: Listings and sales volume:
Here’s how each county’s months of supply (listings / closed sales) has changed, May 2011 to May 2012:
- King: 4.4 to 2.4
- Snohomish: 5.3 to 2.4
- Pierce: 6.1 to 3.9
Does anything in the full spreadsheet jump out to you?


