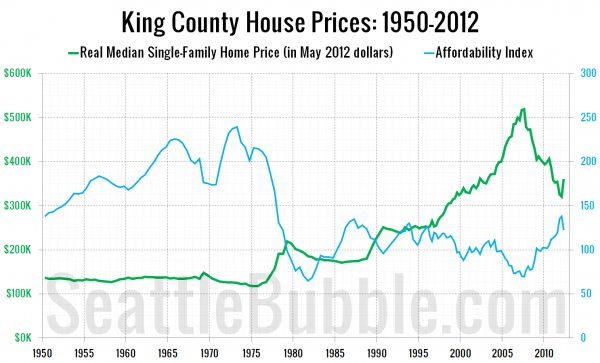
A reader pointed out to me this week that it has been three years since I updated the long-term chart of King County home prices back to 1950. So, by request, here is an update to that chart as of May, along with the affordability index over the same time period.
In the first quarter of 2012 inflation-adjusted home prices had retreated to roughly the same level that they were in Q2 1999. The bounce we’ve seen in the median price so far in Q2 2012 has brought prices back up to Q2 2002 levels.
Ten to thirteen years, zero real appreciation. What a great long-term “investment!”
Sources:
(1946-1992 Home Prices: Seattle Real Estate Research Report)
(1993-2012 Home Prices: NWMLS)
(Misc. Price Data: Seattle Times)
(Inflation Data: Bureau of Labor Statistics – Consumer Price Index)
(Household Income: US Census Bureau)
(1950-1970 Interest Rates: Financial Forecast Center)
(1971-2012 Interest Rates: Federal Reserve)
