June market stats were released by the NWMLS this afternoon. First up, here’s a snippet from their press release:
Sales volume, home prices around Washington state rising amid inventory shortages in many areas.
June may have been cooler and wetter than normal, but weather did not seem to deter home buyers and sellers around western Washington. “Close-in Seattle neighborhoods have been experiencing the most intense buyer activity since 2006,” one broker remarked.
I feel it is worth noting that when prices were falling year after year, “bad weather” was frequently an excuse given by the NWMLS and its members for the decline.
While the press release headline touts “rising prices,” they do allude to the dramatic change in the mix of what’s selling… twelve paragraphs in:
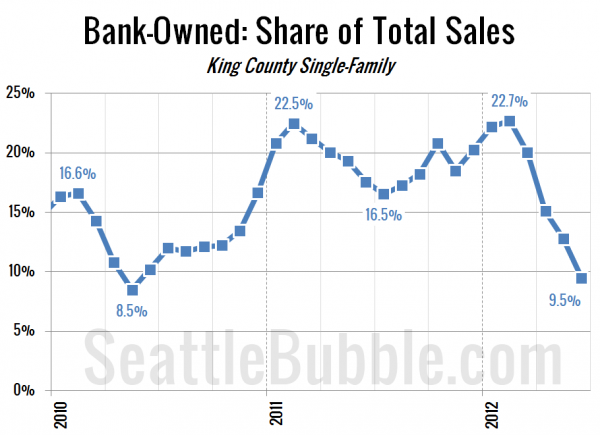
MLS director Diedre Haines, regional managing broker in Snohomish County for Coldwell Banker Bain, said bank owned (REO) property listings are nearly nonexistent compared to a year ago…
The share of sales each month that are bank owned homes is absolutely plummeting, falling to its lowest point since May 2010. This is no doubt the primary driving force behind the dramatic increase we’ve seen in the median price over the last few months. Home prices are indeed going up, but when you account for this change the increase is much less severe.
All righty, on with our usual monthly stats.
NWMLS monthly reports include an undisclosed and varying number of
sales from previous months in their pending and closed sales statistics.
Here’s your King County SFH summary, with the arrows to show whether the year-over-year direction of each indicator is favorable or unfavorable news for buyers and sellers (green = favorable, red = unfavorable):
| June 2012 | Number | MOM | YOY | Buyers | Sellers |
|---|---|---|---|---|---|
| Active Listings | 5,091 | +1.0% | -37.7% |  |
 |
| Closed Sales | 2,117 | +3.0% | +12.4% |  |
 |
| SAAS (?) | 1.32 | -0.9% | -20.7% |  |
 |
| Pending Sales | 2,776 | -6.9% | +16.3% |  |
 |
| Months of Supply | 1.83 | +8.5% | -46.5% |  |
 |
| Median Price* | $380,000 | +5.0% | +10.1% |  |
 |
Feel free to download the updated Seattle Bubble Spreadsheet (Excel 2003 format), but keep in mind the caution above.
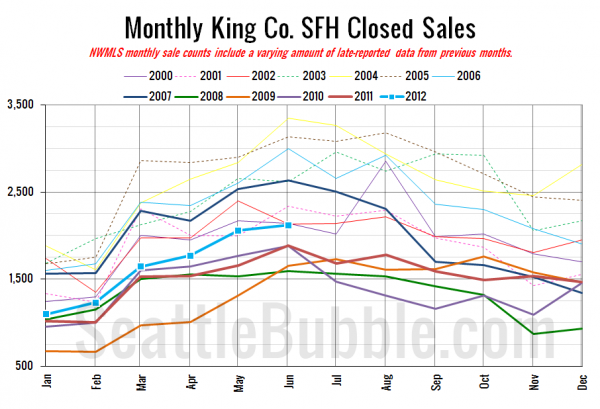
Here’s your closed sales yearly comparison chart:
If 2012 is like most recent years, June will probably be the peak for closed sales.
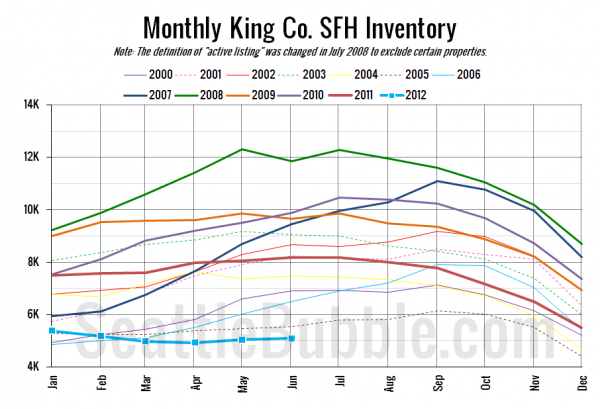
Here’s the graph of inventory with each year overlaid on the same chart.
Another increase, but just barely. Still at record low levels of on-market home selection.
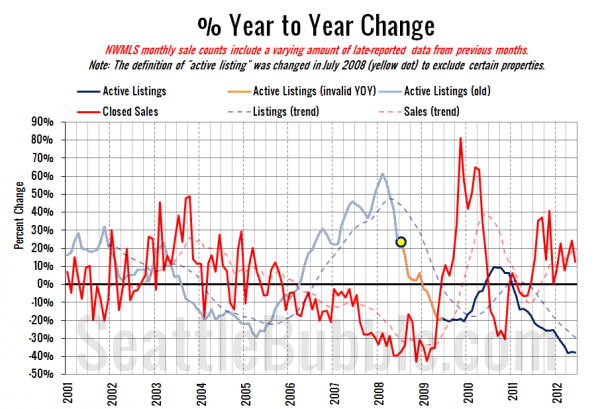
Here’s the supply/demand YOY graph. In place of the now-unreliable measure of pending sales, the “demand” in this chart is represented by closed sales, which have had a consistent definition throughout the decade.
Same basic story we’ve been looking at for a year. Definitely a seller’s market as far as supply and demand goes.
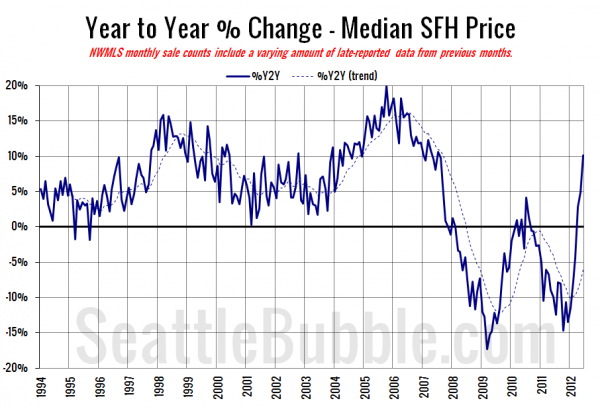
Here’s the median home price YOY change graph:
Double digits, thanks mostly to the big change in the sales mix mentioned above, with far fewer bank-owned homes selling this year than last.
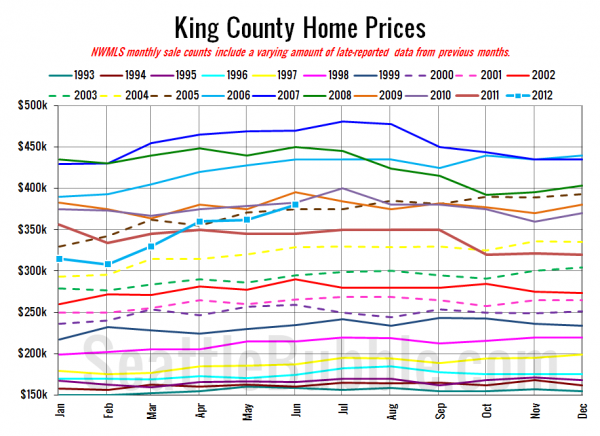
And lastly, here is the chart comparing King County SFH prices each month for every year back to 1994.
June 2012: $380,000
July 2005: $375,000
Here are the Times and P-I headlines.
Seattle Times: King County median home price up 10 percent from year ago
Seattle P-I: King County house prices rise by double digits
Check back tomorrow for the full reporting roundup.
