August market stats were published by the NWMLS this afternoon. Here’s what they have to say about their numbers: September housing statistics around Washington indicate recovery is continuing, strengthening sellers’ positions.
Pending sales, closed sales and prices all increased in August compared to a year ago, according to the latest figures from Northwest Multiple Listing Service. Those key indicators, coupled with the persistent shortage of inventory, prompted one industry leader to declare the market has flipped.
…
“The biggest story this year is that the market has flipped,” proclaimed J. Lennox Scott, chairman and CEO of John L. Scott Real Estate. He attributes the shift to a seller’s market in most areas and prices to a combination of factors, including historically low interest rates, lower adjusted prices, the shortage of inventory, an elevated number of investors, and the return of local home buyers.Northwest MLS directors OB Jacobi and Joe Spencer are similarly encouraged by the latest numbers, mentioning steady momentum, rising consumer confidence, low inventory, a pickup of activity in new construction, and improving prospects for homeowners who are underwater.
There wasn’t anything terribly surprising in this month’s data, just more of the same trends we have been seeing all year: low inventory, increasing sales, prices inching up. Inventory actually did tick up just a bit, but barely enough to even mention.
All righty, on with our usual monthly stats.
NWMLS monthly reports include an undisclosed and varying number of
sales from previous months in their pending and closed sales statistics.
Here’s your King County SFH summary, with the arrows to show whether the year-over-year direction of each indicator is favorable or unfavorable news for buyers and sellers (green = favorable, red = unfavorable):
| August 2012 | Number | MOM | YOY | Buyers | Sellers |
|---|---|---|---|---|---|
| Active Listings | 5,103 | +0.7% | -36.2% |  |
 |
| Closed Sales | 2,162 | +2.0% | +21.8% |  |
 |
| SAAS (?) | 1.29 | +2.8% | -9.0% |  |
 |
| Pending Sales | 2,623 | +2.4% | +12.6% |  |
 |
| Months of Supply | 1.95 | -1.7% | -43.3% |  |
 |
| Median Price* | $378,000 | +0.7% | +8.0% |  |
 |
Feel free to download the updated Seattle Bubble Spreadsheet (Excel 2003 format), but keep in mind the caution above.
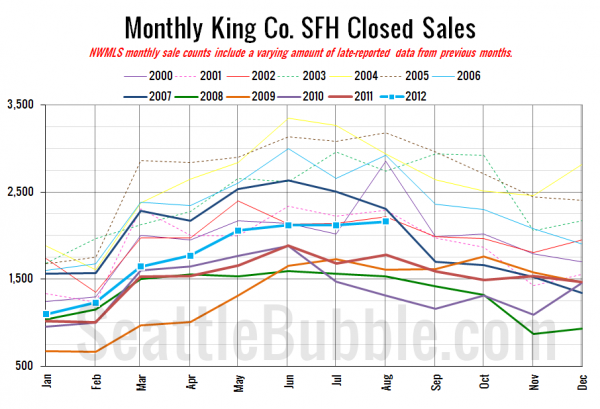
Here’s your closed sales yearly comparison chart:
July to August is mixed—some years up, some down. The slight increase this year was well within the normal range.
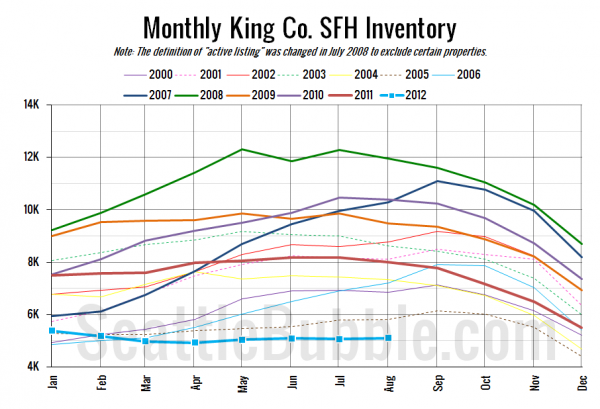
Here’s the graph of inventory with each year overlaid on the same chart.
Very slight uptick, but we’ve basically been flat since April.
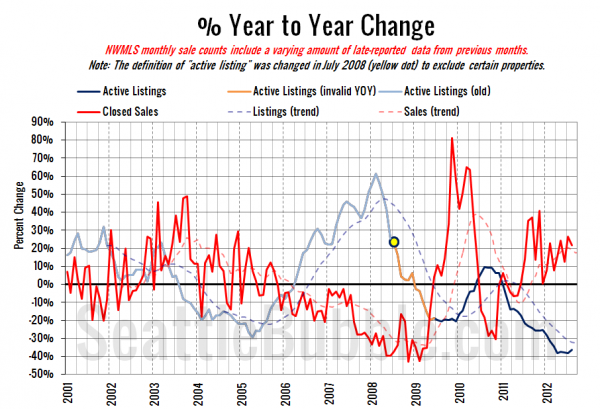
Here’s the supply/demand YOY graph. In place of the now-unreliable measure of pending sales, the “demand” in this chart is represented by closed sales, which have had a consistent definition throughout the decade.
Same story yet again. Sales up, listings down.
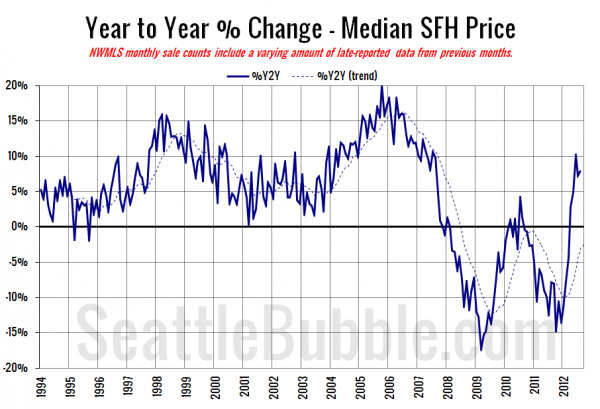
Here’s the median home price YOY change graph:
Still on the rise.
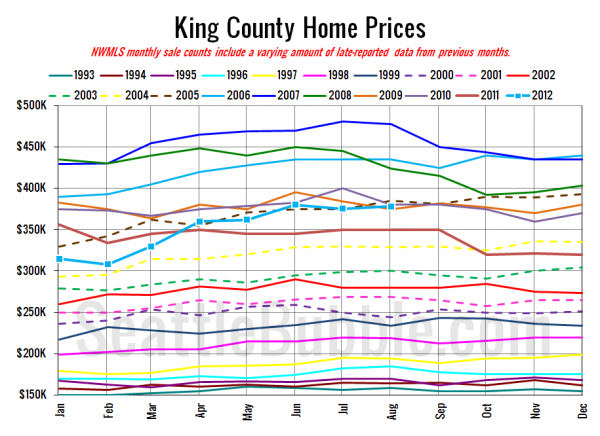
And lastly, here is the chart comparing King County SFH prices each month for every year back to 1994.
August 2012: $378,000
July 2005: $375,000
Here are the Times and P-I headlines.
Seattle Times: Local home sales volume, prices rise in August
Seattle P-I: Seattle-area home shoppers find slim pickings
Check back tomorrow for the full reporting roundup.
