October market stats were published by the NWMLS this morning. Here’s what they have to say about their numbers: Housing recovery continues with prices rising as inventory dips to lowest level since 2006.
The shortage of inventory is helping propel prices. J. Lennox Scott, chairman and CEO of John L. Scott Real Estate, commented on the correlation of sharply reduced inventory and rising prices. “The rise in prices is derived from seasonally strong sales activity in a shortage of inventory market,” he remarked.
Nothing too earth-shattering this month, but the “rise in prices” is not really as much of a rise as it seems, as I’ll explain shortly.
All righty, on with our usual monthly stats.
NWMLS monthly reports include an undisclosed and varying number of
sales from previous months in their pending and closed sales statistics.
Here’s your King County SFH summary, with the arrows to show whether the year-over-year direction of each indicator is favorable or unfavorable news for buyers and sellers (green = favorable, red = unfavorable):
| October 2012 | Number | MOM | YOY | Buyers | Sellers |
|---|---|---|---|---|---|
| Active Listings | 4,304 | -14.0% | -40.0% |  |
 |
| Closed Sales | 1,981 | +10.2% | +33.0% |  |
 |
| SAAS (?) | 1.08 | -16.6% | -26.4% |  |
 |
| Pending Sales | 2,676 | +10.3% | +23.5% |  |
 |
| Months of Supply | 1.61 | -22.1% | -51.4% |  |
 |
| Median Price* | $370,000 | -1.3% | +15.6% |  |
 |
Feel free to download the updated Seattle Bubble Spreadsheet (Excel 2003 format), but keep in mind the caution above.
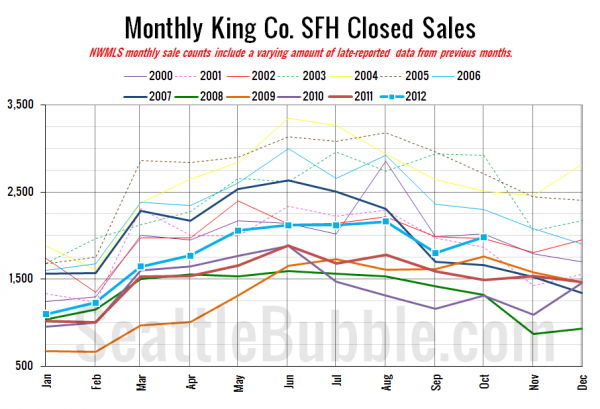
Here’s your closed sales yearly comparison chart:
Somewhat odd that sales bumped up between September and October, but not unexpected since it’s exactly what we saw in the Stats Preview last week.
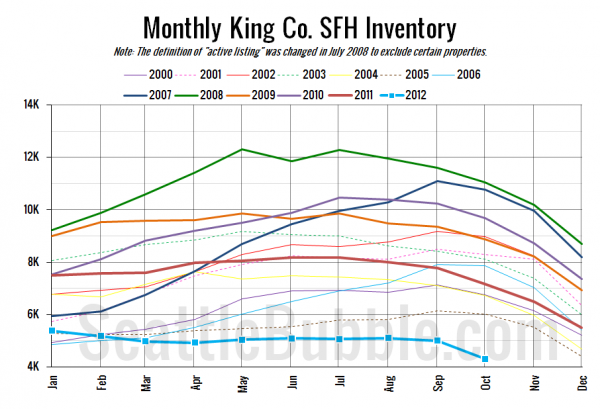
Here’s the graph of inventory with each year overlaid on the same chart.
Inventory has never been this low as far back as I have reliable data from the NWMLS (January 2000). Expect new lows again in November and December. Here’s hoping that next year things go back to the normal seasonal pattern of gaining inventory in the first half of the year.
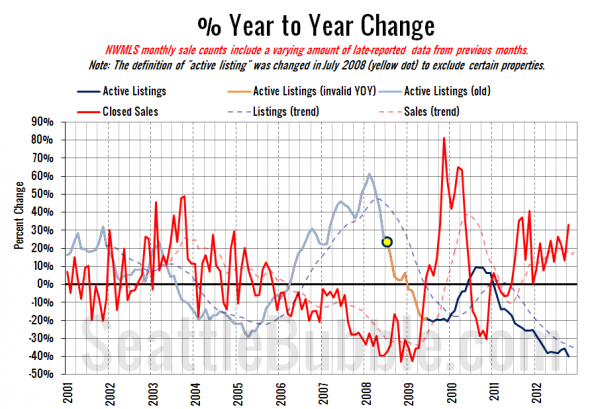
Here’s the supply/demand YOY graph. In place of the now-unreliable measure of pending sales, the “demand” in this chart is represented by closed sales, which have had a consistent definition throughout the decade.
Same story yet again. Sales up, listings down.
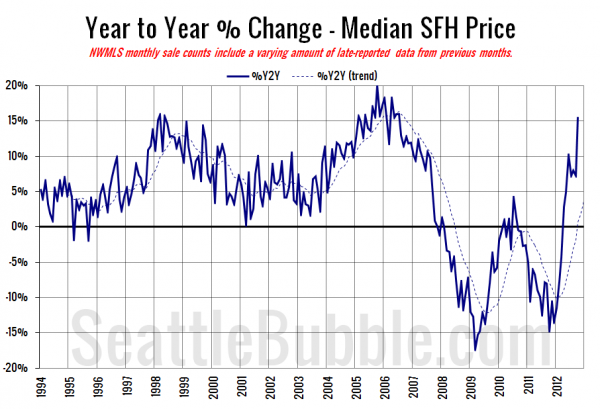
Here’s the median home price YOY change graph:
Big jump, not because home prices surged in any way this year, but because last year they plunged learly $30k from $349,550 in September to $320,000 in October. If you care a lot about what happened to home prices a year ago, then a sudden jump to a 16% year-over-year increase in the median price is the biggest news in today’s data, despite being the most predictable, least surprising bit.
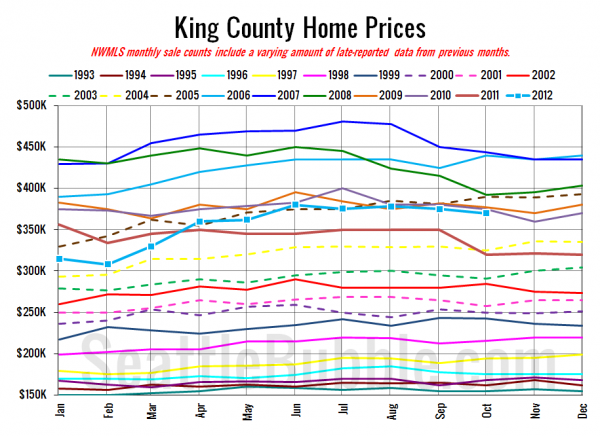
And lastly, here is the chart comparing King County SFH prices each month for every year back to 1994.
October 2012: $370,000
May 2005: $375,500
Here are the Times and P-I headlines.
Seattle Times: King County house prices rise 16 percent year-over-year
Seattle P-I: Home prices post biggest jump in six years
Check back tomorrow for the full reporting roundup.
