November market stats were published by the NWMLS this morning. Here’s what they have to say about their numbers: High demand, low inventory sparking multiple offers, market momentum.
“There continues to be extremely low inventory levels and high buyer demand which is causing multiple offers in many local areas,” reported OB Jacobi, president of Windermere Real Estate. He also noted a “definite uptick” in the number of cash buyers, “many of which are investors.”
Commenting on the expected dip in activity, Jacobi, a member of the Northwest MLS board of directors, said it “was less than we usually experience during this time of year.” Based on the current combination of sparse inventory and high buyer demand, Jacobi said those who are considering selling are encouraged to “list their homes sooner rather than later” in order to take advantage of unique market conditions.
Unfortunately, many would-be sellers are still “uniquely” low on equity.
All righty, on with our usual monthly stats.
NWMLS monthly reports include an undisclosed and varying number of
sales from previous months in their pending and closed sales statistics.
Here’s your King County SFH summary, with the arrows to show whether the year-over-year direction of each indicator is favorable or unfavorable news for buyers and sellers (green = favorable, red = unfavorable):
| November 2012 | Number | MOM | YOY | Buyers | Sellers |
|---|---|---|---|---|---|
| Active Listings | 3,720 | -13.6% | -42.7% |  |
 |
| Closed Sales | 1,828 | -7.7% | +18.9% |  |
 |
| SAAS (?) | 1.03 | -4.7% | -23.3% |  |
 |
| Pending Sales | 2,052 | -23.3% | +6.6% |  |
 |
| Months of Supply | 1.81 | +12.7% | -46.2% |  |
 |
| Median Price* | $385,000 | +4.1% | +19.7% |  |
 |
Feel free to download the updated Seattle Bubble Spreadsheet (Excel 2003 format), but keep in mind the caution above.
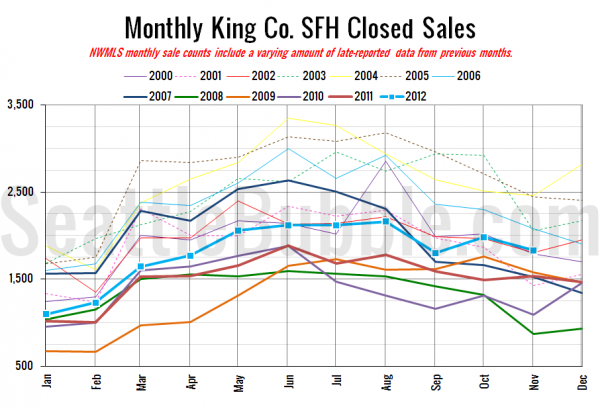
Here’s your closed sales yearly comparison chart:
Nothing out of the ordinary here, just a normal movement for this time of year.
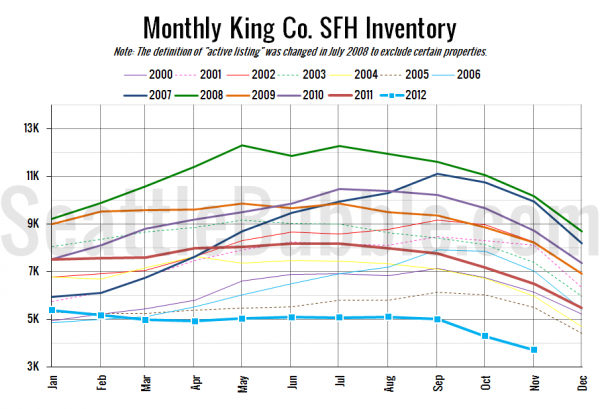
Here’s the graph of inventory with each year overlaid on the same chart.
Another record low for inventory, dropping below 4,000 single-family homes for the first time on record.
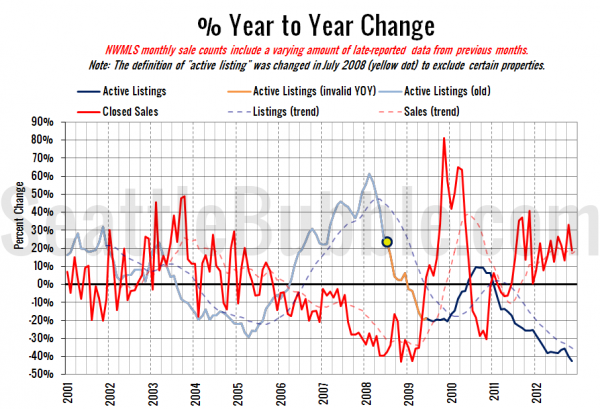
Here’s the supply/demand YOY graph. In place of the now-unreliable measure of pending sales, the “demand” in this chart is represented by closed sales, which have had a consistent definition throughout the decade.
Same basic story as the entire last year.
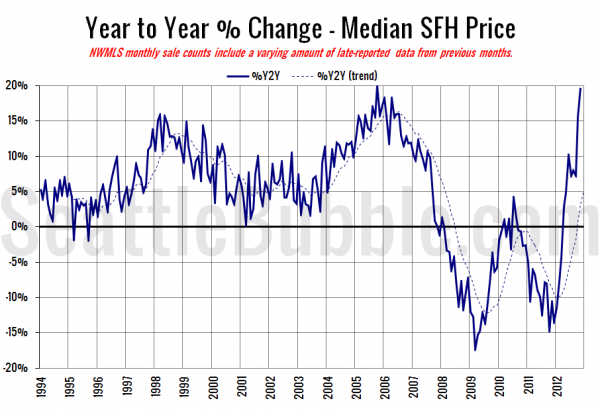
Here’s the median home price YOY change graph:
Another big jump, not because home prices surged in any way this year, but because last year they plunged late in the year, and because this year there are so few bank-owned homes in the mix, while last year at this time nearly one in five sales were bank-owned homes.
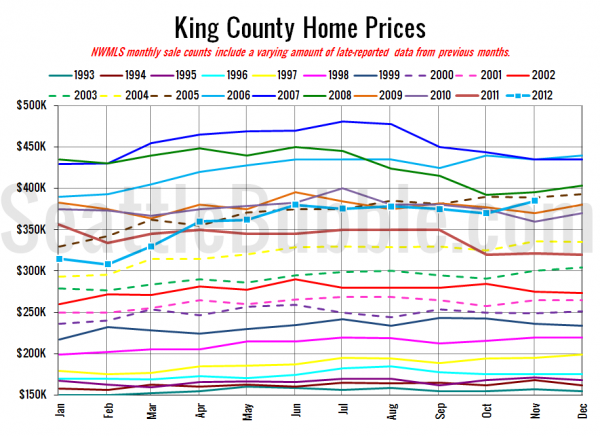
And lastly, here is the chart comparing King County SFH prices each month for every year back to 1994.
November 2012: $385,000
August 2005: $385,500
No stories have been posted yet at the Times and P-I. I’ll update this post when I see them.
