It has been a while since we had a look at the local affordability index, and now that we’ve got all of the data for 2012, it seemed like a good time to take another look.
As a reminder, the affordability index is based on three factors: median single-family home price as reported by the NWMLS, 30-year monthly mortgage rates as reported by the Federal Reserve, and estimated median household income as reported by the Washington State Office of Financial Management.
The historic standard for affordable housing is that monthly costs do not exceed 30% of one’s income. Therefore, the formula for the affordability index is as follows:
For a more detailed examination of what the affordability index is and what it isn’t, I invite you to read this 2009 post.
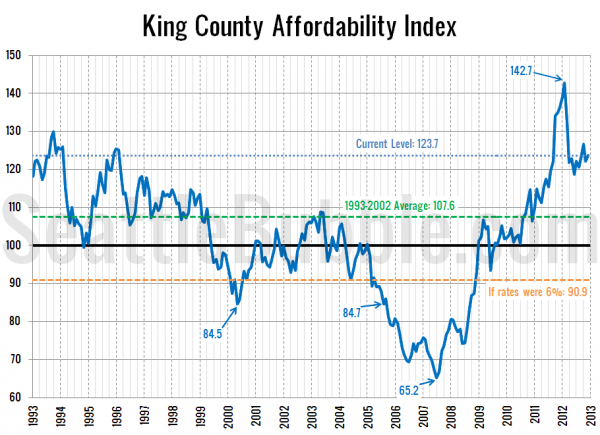
So how does affordability look as of December? Thanks to still-crazy-low interest rates, pretty good:
I’ve marked where affordability would be if interest rates were at a more sane level of 6%. The picture is decidedly less appealing in that scenario, but still not dire.
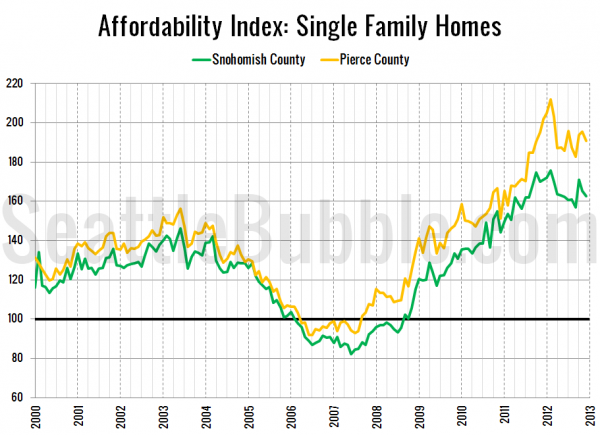
Here’s a look at the index for Snohomish County and Pierce County since 2000:
Now if only there were actually homes available to buy.


