December market stats were published by the NWMLS this morning. Here’s a snippet from their press release: Brokers report brisk sales, but rising frustration for home buyers.
“I personally have never seen the ratio between active buyers and available inventory in Seattle’s close-in neighborhoods so out of balance,” remarked Mike Skahen, owner/designated broker at Lake & Co. Real Estate in Seattle. Skahen, a real estate professional since 1976, said multiple offers and bids well over the list price are common. “Even homes that were hard to sell for various reasons are being snapped up so those sellers were wise to list,” he added.
Lena Maul, a new member of the Northwest MLS board of directors, and the designated broker/owner at Windermere/North in Lynnwood, agreed now is a good time for sellers to list. “Sellers who are considering a spring or summer listing may want to consider listing now as demand is outweighing supply,” she noted, adding, “This has given well priced sellers the advantage with the benefit of quick sales and multiple offers.”
…
“Buyers should not forget the human element of appealing to a seller in this multiple offer market,” Maul emphasized, adding, “You just never know who is on the other side of a transaction and what might be important to them. In this case, selling their home to an owner occupant who appreciated special features of their home versus an investor sealed the deal, not cash.”
Ugh, gross. Personally, if I have to write a love note to the seller and grovel to get them to accept my offer, that’s a sign to me that I should either find another house or take a break from the market and try again next year.
All righty, on with our usual monthly stats.
NWMLS monthly reports include an undisclosed and varying number of
sales from previous months in their pending and closed sales statistics.
Here’s your King County SFH summary, with the arrows to show whether the year-over-year direction of each indicator is favorable or unfavorable news for buyers and sellers (green = favorable, red = unfavorable):
| January 2013 | Number | MOM | YOY | Buyers | Sellers |
|---|---|---|---|---|---|
| Active Listings | 2,975 | +1.0% | -44.7% |  |
 |
| Closed Sales | 1,363 | -21.7% | +24.5% |  |
 |
| SAAS (?) | 1.05 | -15.1% | -14.8% |  |
 |
| Pending Sales | 2,109 | +30.4% | +12.7% |  |
 |
| Months of Supply | 1.41 | -22.5% | -50.9% |  |
 |
| Median Price* | $350,000 | -7.9% | +12.5% |  |
 |
Feel free to download the updated Seattle Bubble Spreadsheet (Excel 2003 format), but keep in mind the caution above.
This is the lowest months of supply has ever been as far back as my data goes (January 2000). Of course, the NWMLS changed the definition of “active listing” in July 2008, so months of supply before and after that point aren’t really directly comparable. Still though, 1.4 months of supply is insanely low by any measure.
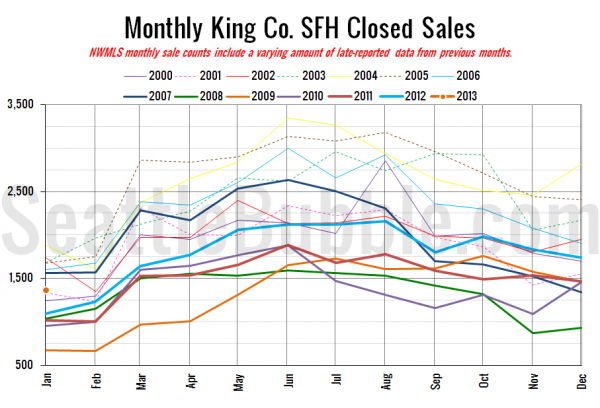
Here’s your closed sales yearly comparison chart:
Closed sales came in higher than any year since 2007.
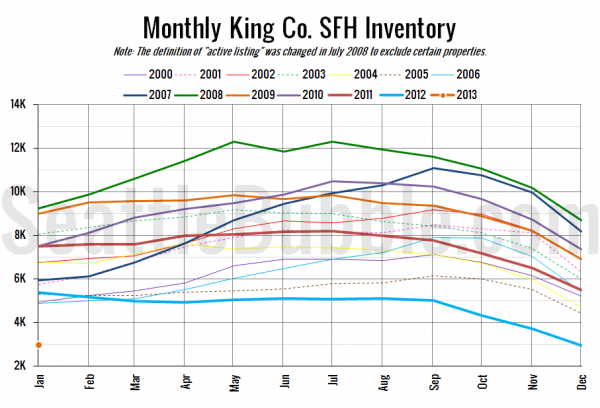
Here’s the graph of inventory with each year overlaid on the same chart.
It is crazy how much lower inventory is to start off 2013 than it has been in any other year.
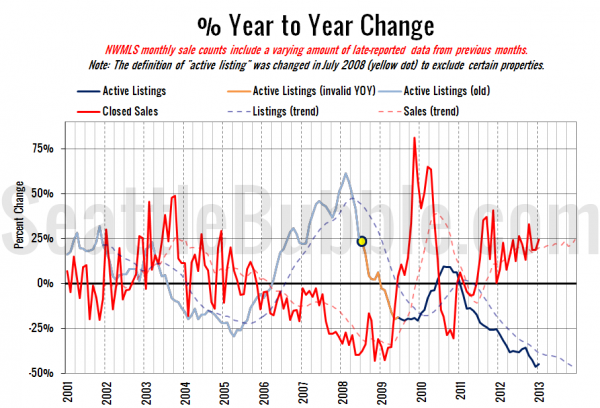
Here’s the supply/demand YOY graph. In place of the now-unreliable measure of pending sales, the “demand” in this chart is represented by closed sales, which have had a consistent definition throughout the decade.
Same basic story we’ve seen since late 2011, with no sign of a change as of yet.
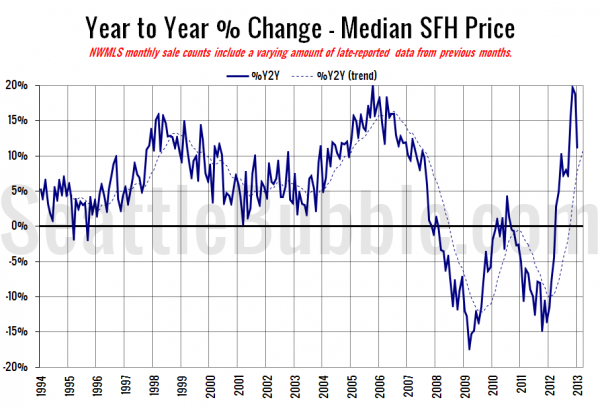
Here’s the median home price YOY change graph:
Big drop from a month ago, but still up over double digits. I expect this to continue to fall as we begin to compare year-over-year numbers with similar shares of bank-owned homes in the mix.
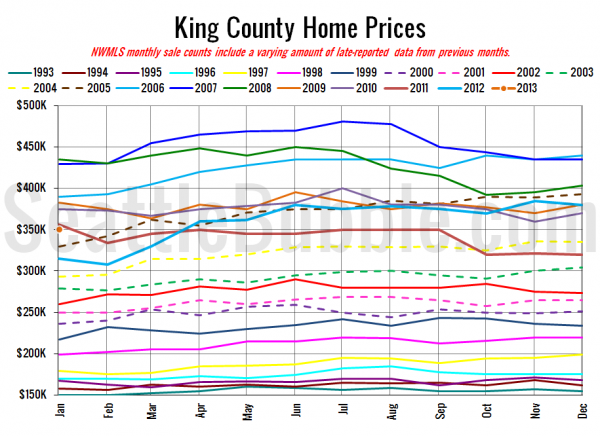
And lastly, here is the chart comparing King County SFH prices each month for every year back to 1994.
January 2013: $350,000
April 2005: $350,000
As of yet I haven’t seen any stories posted on the Times or P-I. I’ll update this post when they do.
Check back tomorrow for the full reporting roundup.
[Update]
Seattle Times: King County home prices dip to March lows
Seattle P-I: Low home inventory driving up prices
