It’s been a while since I posted an update of my charts based on the stats from Redfin’s King County region page, so let’s take a look at those.
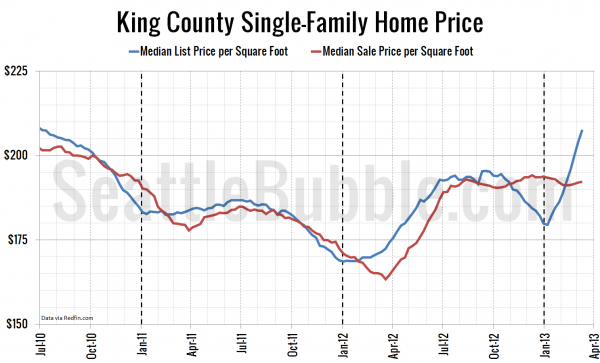
First up the median list and sale prices per square foot. Note that the list price below includes all homes on the market, whether or not they eventually sell, so it tends to be biased toward higher numbers than the sale price chart.
After ramping up steeply last spring and early summer, sale prices hit a bit of a peak in September, and have been basically plateaued since then. Listing prices dove at the close of the year and are shooting back up in early 2013 faster than we’ve seen in years, but so far this has not carried through to sale prices.
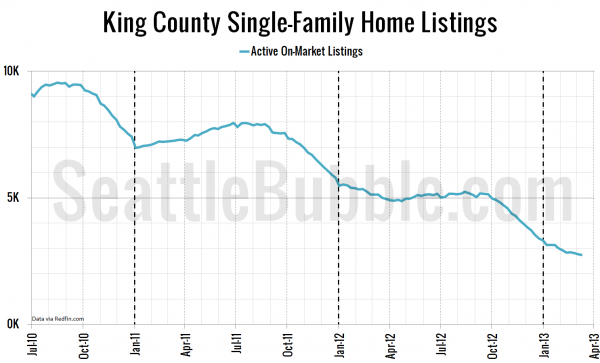
The total number of listings on the market continues to fall to ever-more-depressing levels:
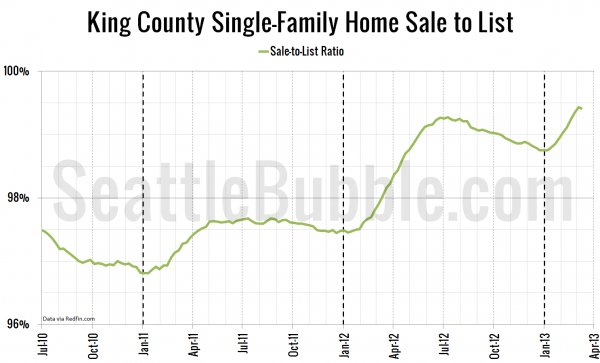
And the latest average sale-to-list ratio came in at 99.4%, the highest it’s been since sometime before 2010 and probably since 2005 or 2006.
It’s interesting to me that despite record low inventory, and increasingly frequent multiple offers, the average sale-to-list ratio is still below 100% here in the Seattle area.
No doubt there are many homes that are selling above asking price, but an average below 100% coupled with prices that are basically flat since September suggests to me that the market is not quite to the point where I’d call it “overheated” just yet.
Full disclosure: The Tim is employed by Redfin.


