RT @NickTimiraos: This chart puts the housing 'recovery' in context, ie., when a 23% price gain means you're still down by 44% http://t.co/… -> RT @NickTimiraos: The housing market: everyone wants to buy at the bottom, but few want to sell http://t.co/jTqRcWuoXY ->
Month: May 2013
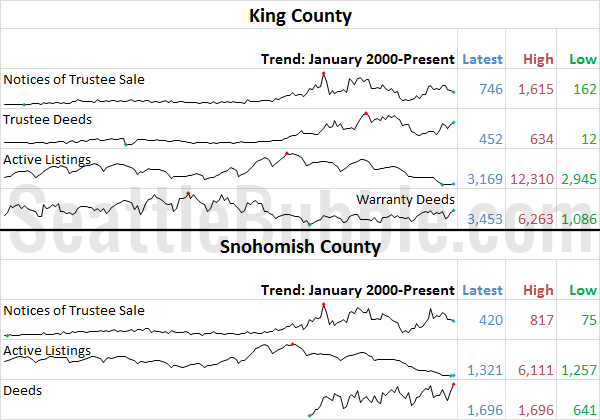
April Stats Preview: Finally Some Inventory Edition
With April 2013 in the history books, let’s have a look at our stats preview. Most of the charts below are based on broad county-wide data that is available through a simple search of King County and Snohomish County public records. If you have additional stats you’d like to see in the preview, drop a…
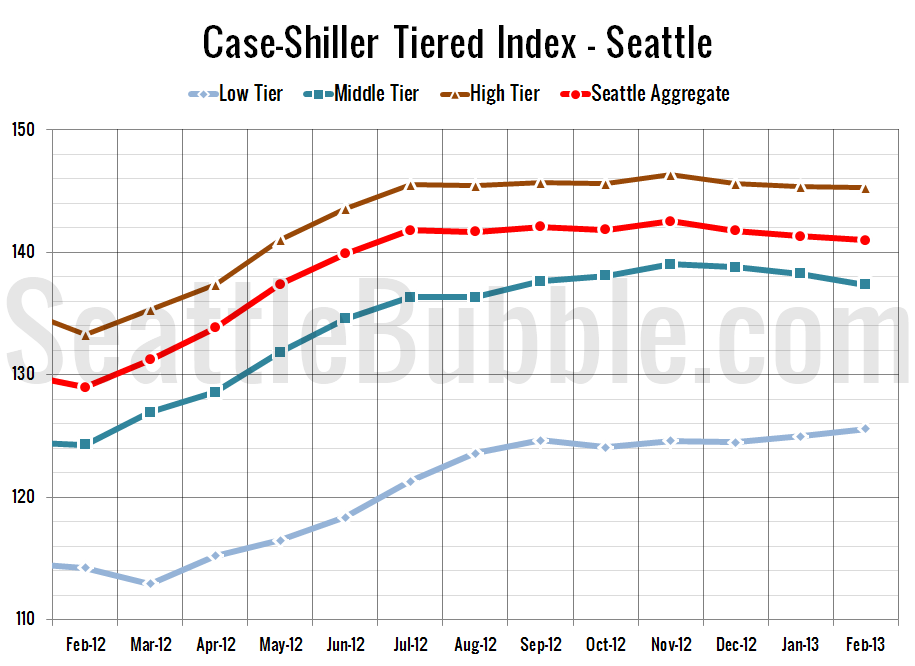
Case-Shiller Tiers: Low Tier Gains, Middle Tier Loses
Let’s check out the three price tiers for the Seattle area, as measured by Case-Shiller. Remember, Case-Shiller’s “Seattle” data is based on single-family home repeat sales in King, Pierce, and Snohomish counties. Note that the tiers are determined by sale volume. In other words, 1/3 of all sales fall into each tier. For more details…