New local job stats came out this week, so let’s have a look at the Seattle area’s employment situation.
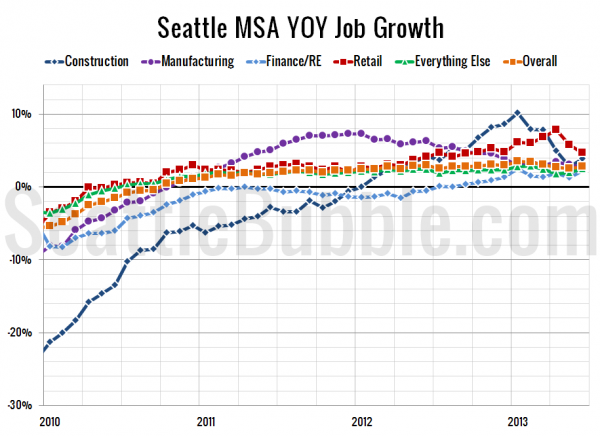
First up, year-over-year job growth, broken down into a few relevant sectors:
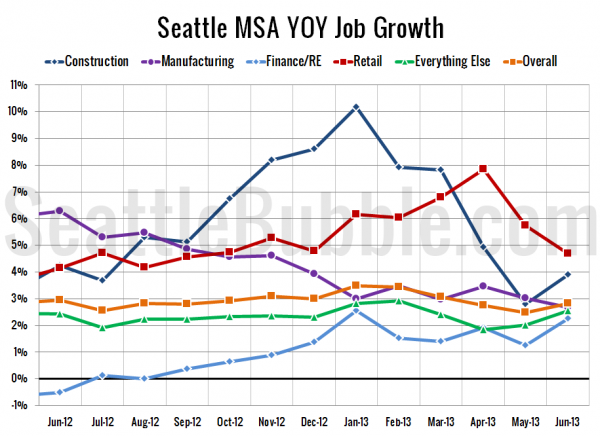
Since things are getting really jumbled together lately on that chart, I broke down just the last year and zoomed in so you can see what’s going on:
With 4.7% year-over-year growth, the retail sector was again the fastest-growing in June. Overall year-over-year growth increased from 2.5% in May to 2.8% in June.
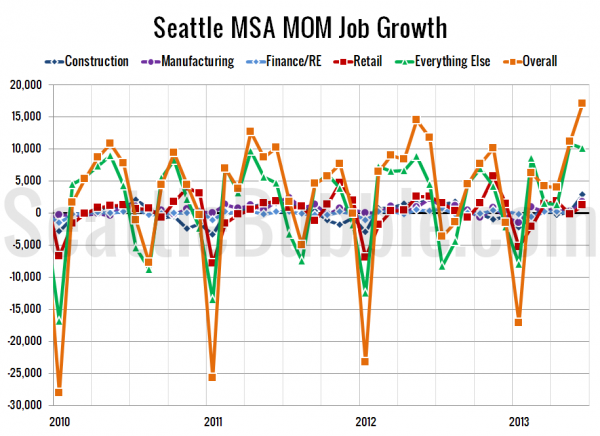
Surprisingly, even though the year-over-year growth is still relatively weak, the 17,100 jobs that were added between May and June (not adjusted for seasonality) is more than any month since March 2000. Here’s what the raw monthly picture looks like over the last few years:
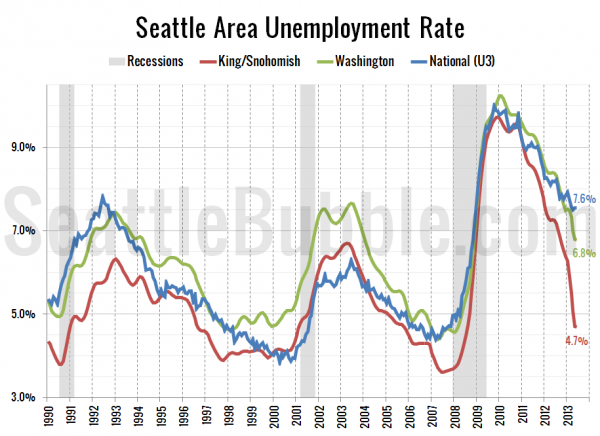
Next up, here’s a look at the overall Seattle area unemployment rate compared to the national rate:
Unemployment was flat at 4.7% in the Seattle area in June. Washington State unemployment also leveled off, matching May’s 6.8% rate. The national level was totally flat as well at 7.6%.
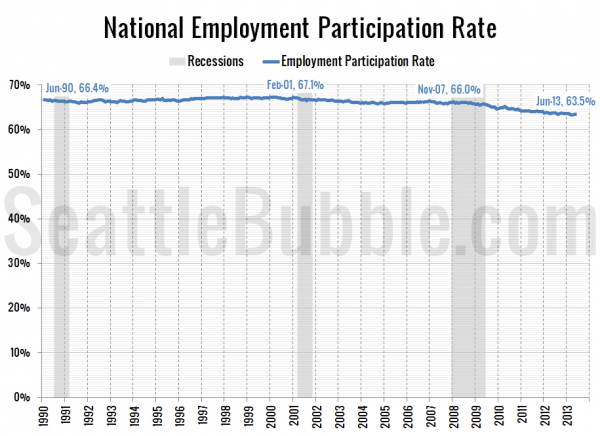
By request, here’s a chart showing the national labor participation rate. The unemployment rate is calculated by dividing the number of unemployed people by the “total labor force.” The participation rate is the “total labor force” divided by the total population of people 16 and older. Unfortunately monthly population estimates broken down by age don’t exist at a state or county level (or if they do I could not locate them).
The national participation rate currently stands 2.5 points below where it was before the “great recession” began in late 2007, and has been mostly flat for a year.
- Seattle Job Levels: Washington State Employment Security Department
- Seattle & Washington Unemployment: Washington State Employment Security Department
- National Unemployment: Bureau of Labor Statistics
Seasonally adjusted series used for all data sets.

