July market stats were published by the NWMLS this morning. Here’s a snippet from their press release: Home sales, prices still rising in Western Washington despite lean inventory and increasing mortgage rates.
Rising interest rates, rising prices and rising consumer confidence are creating a “positive cyclone of home sales activity,” according to members of the Northwest Multiple Listing Service. A robust job market around the Greater Seattle area is also spurring sales.
Wow. It’s like they’re parodying themselves. “Positive cyclone of home sales activity”?!? Just wow. What can I even say to that?
On with our usual monthly stats.
NWMLS monthly reports include an undisclosed and varying number of
sales from previous months in their pending and closed sales statistics.
Here’s your King County SFH summary, with the arrows to show whether the year-over-year direction of each indicator is favorable or unfavorable news for buyers and sellers (green = favorable, red = unfavorable):
| July 2013 | Number | MOM | YOY | Buyers | Sellers |
|---|---|---|---|---|---|
| Active Listings | 4,582 | +9.0% | -9.6% |  |
 |
| Closed Sales | 2,648 | +9.3% | +24.9% |  |
 |
| SAAS (?) | 1.30 | -8.5% | +3.5% |  |
 |
| Pending Sales | 3,010 | -2.7% | +17.5% |  |
 |
| Months of Supply | 1.52 | +12.0% | -23.1% |  |
 |
| Median Price* | $434,000 | +1.5% | +15.7% |  |
 |
Feel free to download the updated Seattle Bubble Spreadsheet (Excel 2003 format), but keep in mind the caution above.
Another nice increase in inventory, while pending sales dropped for the second month in a row. The market is definitely shifting back toward buyers, however slowly.
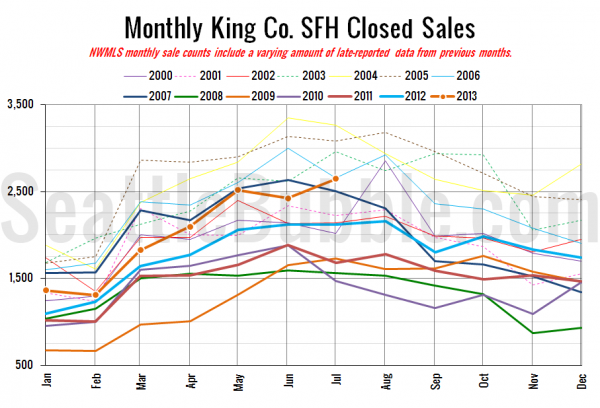
Here’s your closed sales yearly comparison chart:
Making up for last month’s dip, closed sales increased in July. I fully expect this number to decrease for most of the remainder of the year.
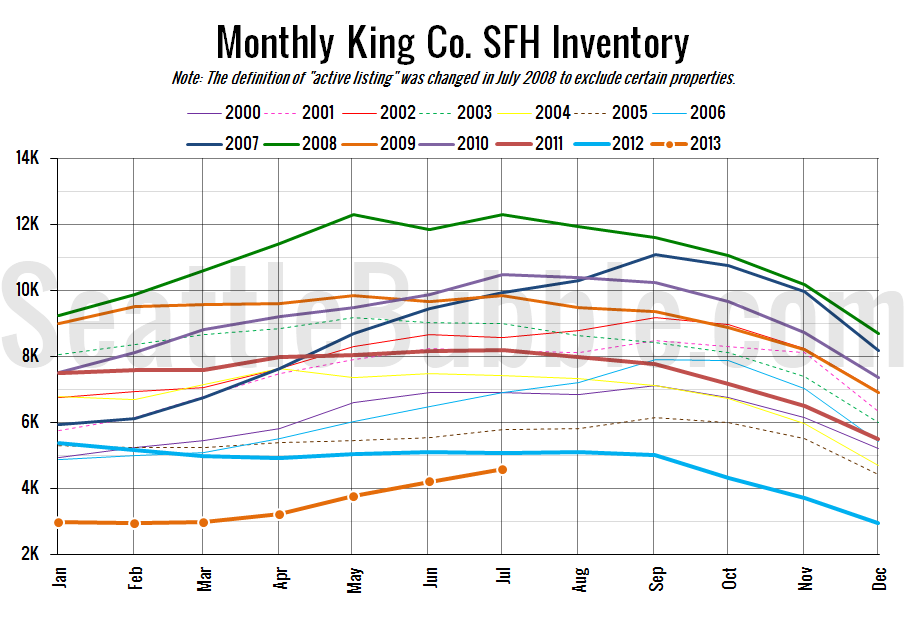
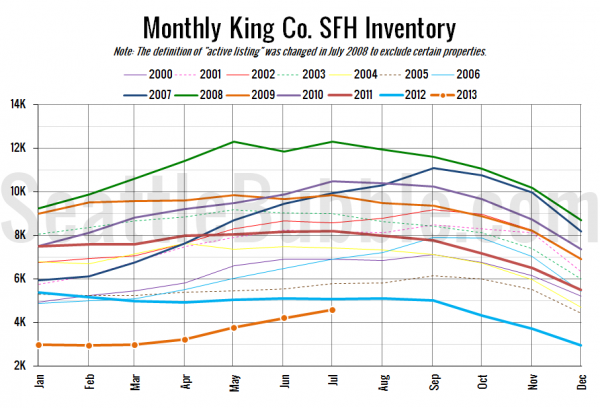
Here’s the graph of inventory with each year overlaid on the same chart.
A little over a month ago I pointed out that inventory is on track to beat 2012 by August. So far that still looks like a strong possiblity.
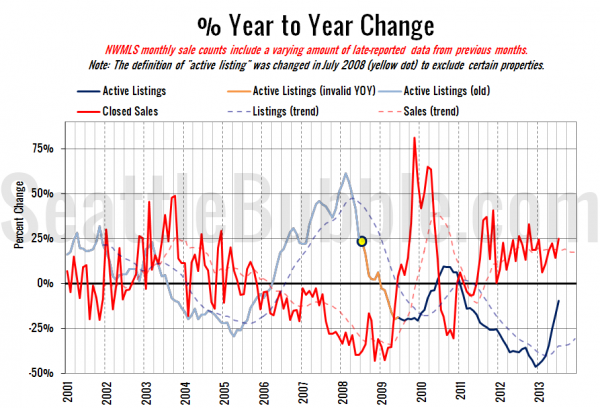
Here’s the supply/demand YOY graph. In place of the now-unreliable measure of pending sales, the “demand” in this chart is represented by closed sales, which have had a consistent definition throughout the decade.
The inventory line is still rapidly heading toward zero. The sales line keeps bouncing back and forth, with July posting the largest gain since January.
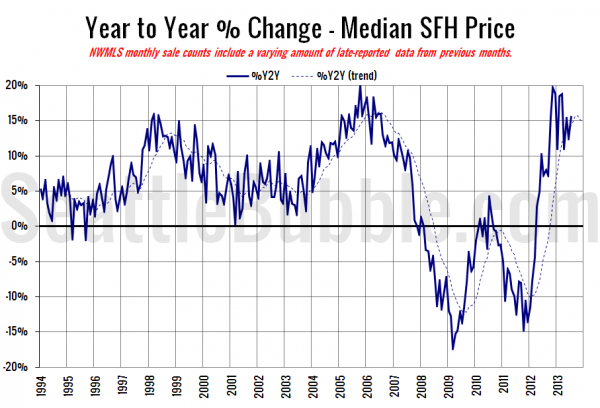
Here’s the median home price YOY change graph:
Yet another bump up as the median home price gained $6,500 in a single month.
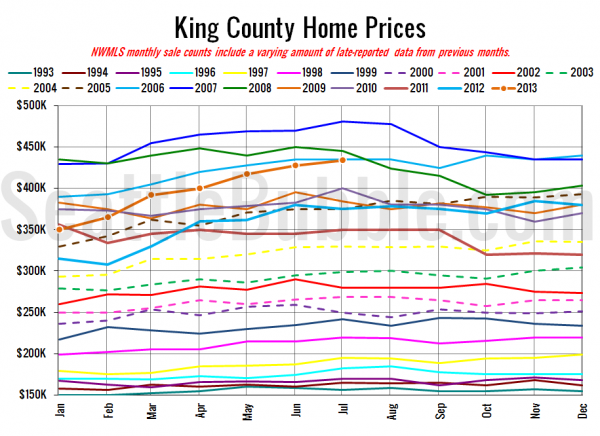
And lastly, here is the chart comparing King County SFH prices each month for every year back to 1994.
July 2013: $434,000
June 2006: $434,950
I haven’t seen any articles about the numbers yet at the Times and P-I, but I’ll update this post when they’re posted.
Update: Here they are.
Seattle Times: King County median home price up 15 percent over year ago
Seattle P-I: More homes hit market, but supply still tight
Check back tomorrow for the full reporting roundup.
