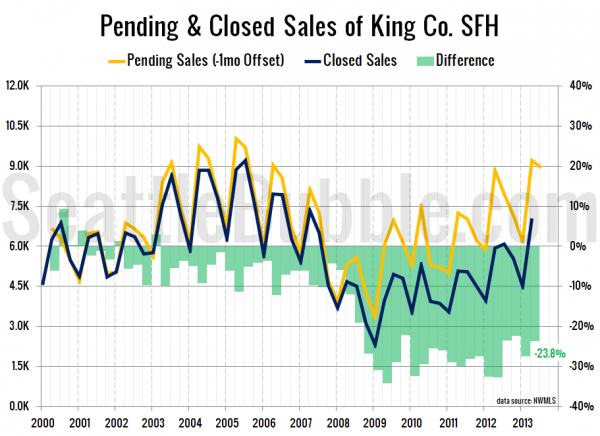
It’s been quite a while since we last had a look at the percentage of pending sales that turn into closed sales, so let’s refresh that chart and take a look a the latest data.
This particular series is fairly noisy when you look at it with monthly granularity, so for this post I’ve rolled the pending sales and closed sales data up by quarter, with pending sales offset by one month. In other words, the second quarter numbers below represent closed sales from April, May, and June and pending sales from March, April, and May.
I had actually expected that with as hot as the market has been this year that we would have seen the gap between pending and closed sales begin to close. So far there has not been as much movement as I expected. The gap was bouncing around between 28% and 33% through 2011 and early 2012, but has only dipped down to 23.8% in the latest quarter—a far cry from the 4.5% average difference between the two numbers from 2000 through 2007.
In 2009 through 2011 I would have attributed much of this gap to the large volume of short sales, which took months to close if they even closed at all, but short sales have fallen to a small fraction of the market now, so that is clearly not what is behind almost one in four pending sales failing to show up as closed sales.
My theory is that despite the hot market, buyers today are still more cautious than they were when everyone believed that “home prices can only go up.” They’re more likely to be on the lookout for deal-breakers and back out of a home sale when something comes up.

