It’s time for us to check up on stats outside of the King/Snohomish core with our “Around the Sound” statistics.
If there is certain data you would like to see or ways you would like to see the data presented differently, drop a comment below and let me know.
First up, a summary table:
| September 2013 | King | Snohomish | Pierce | Kitsap | Thurston | Island | Skagit | Whatcom |
|---|---|---|---|---|---|---|---|---|
| Median Price | $420,000 | $304,475 | $223,500 | $245,900 | $229,750 | $271,000 | $235,000 | $277,250 |
| Price YOY | 12.0% | 8.7% | 6.4% | 1.2% | 8.1% | -1.4% | -0.3% | 11.3% |
| Active Listings | 4,965 | 2,324 | 3,541 | 1,440 | 1,270 | 803 | 831 | 1,330 |
| Listings YOY | -0.8% | 22.6% | 3.1% | -2.2% | 3.9% | -2.3% | -1.1% | 1.9% |
| Closed Sales | 2,200 | 860 | 940 | 279 | 346 | 147 | 167 | 264 |
| Sales YOY | 22.4% | 13.9% | 32.2% | 24.0% | 21.0% | 69.0% | 45.2% | 45.1% |
| Months of Supply | 2.0 | 2.4 | 3.1 | 4.3 | 3.7 | 5.5 | 5.0 | 5.0 |
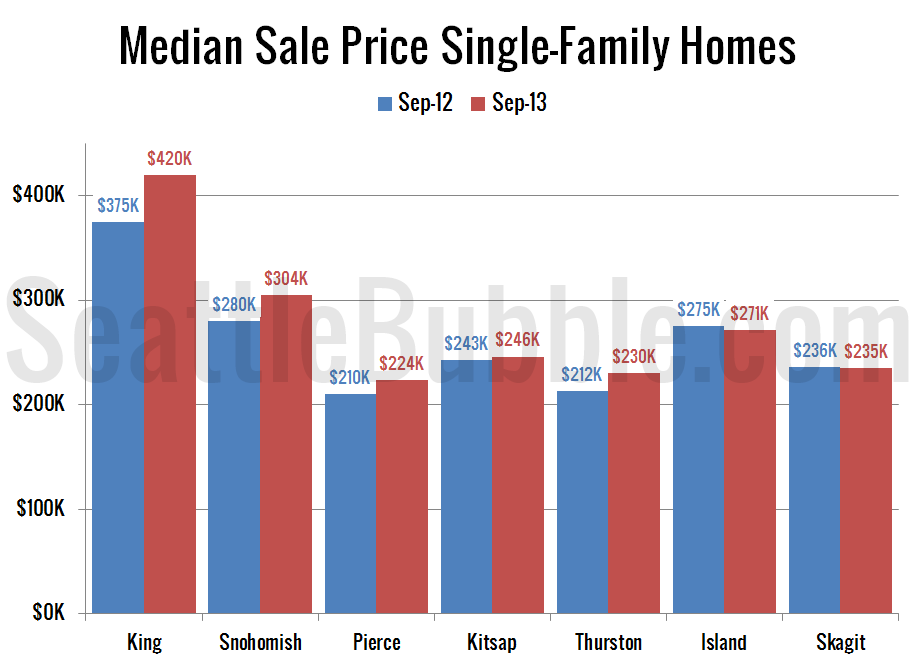
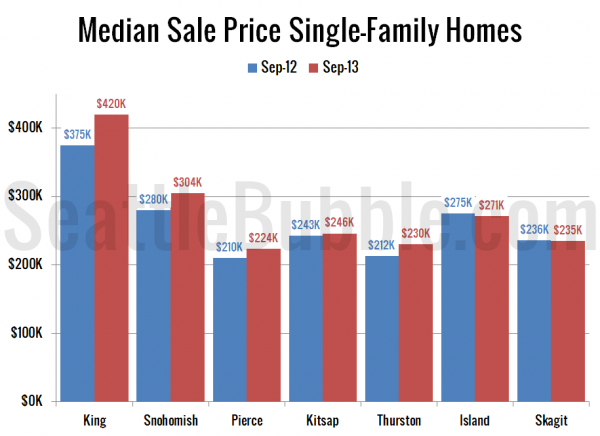
Next we’ll have a look at median prices in September compared to a year earlier. King County and Whatcom county had the biggest gains from 2012, while Island and Skagit actually saw prices drop a little from a year ago.
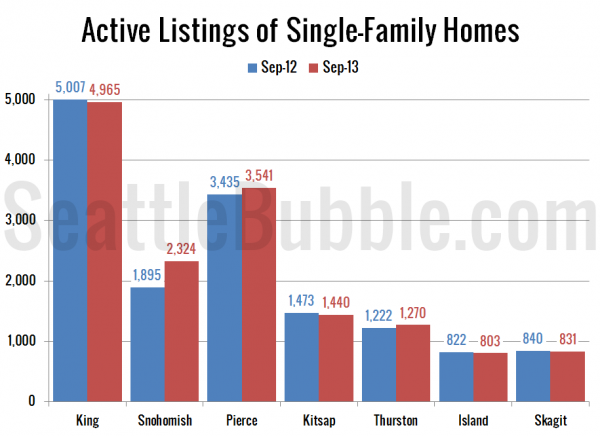
Listings are still down in King, Kitsap, Island, and Skagit, but up in Snohomish, Pierce, Thurston, and Whatcom. Snohomish County saw a whopping 22.6% jump in listings from a year ago.
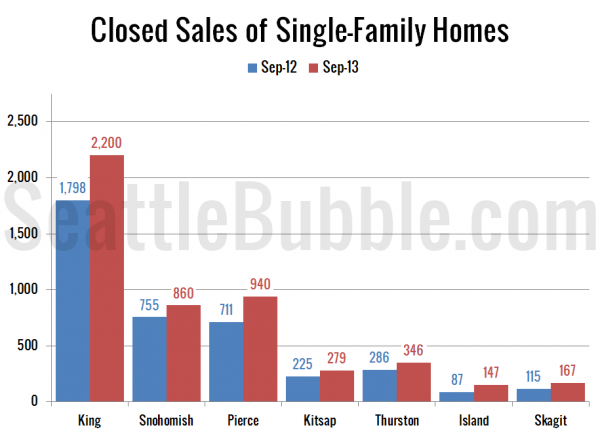
Sales are still up in every county compared to a year ago. The largest gain was once again in Island County, which saw a whopping 69.0% jump from last September. The smallest gain was in Snohomish, where sales were up 13.9%.
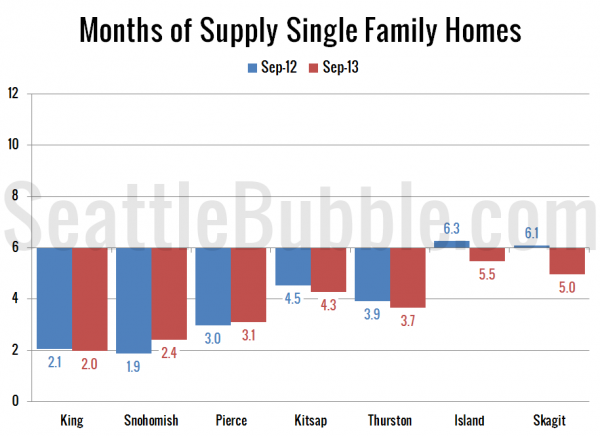
Finally, here’s a chart showing months of supply this September and last September. Months of supply is down in most counties, but Snohomish and Pierce both saw increases thanks to the improving inventory situation in those counties.
Right now Snohomish County seems to be leading the way in the move back toward a buyer’s market, while King County is lagging the most.
