Let’s have a look at how listings are doing over the last few months.
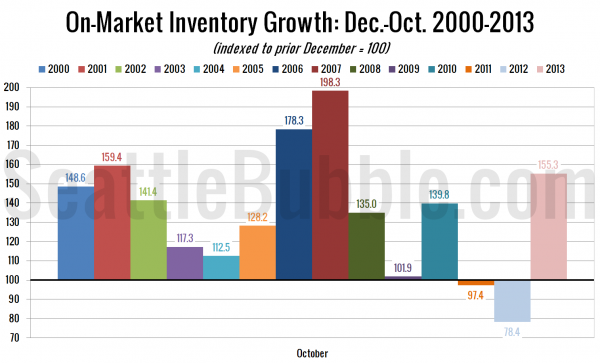
First up, here’s a view of how inventory has grown so far this year:
2013 is shaping up to have the fourth-largest one-year growth in inventory on record, behind 2007, 2006, and 2001.
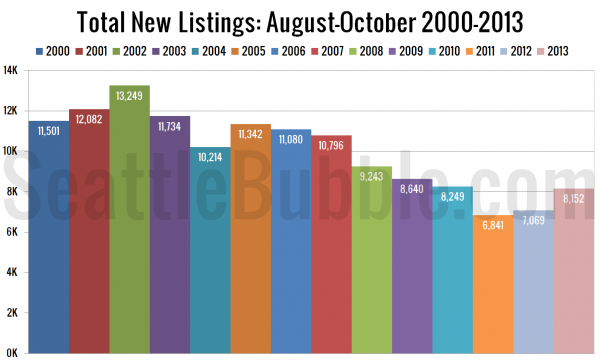
Next, the last three months’ worth of new listings, comparing 2013 to every year I’ve got data for.
August through October 2013 saw more new listings than the same period in 2012 and 2011. Unfortunately for buyers this measure is getting slightly worse, as just two months ago we were also beating 2010 and 2009.
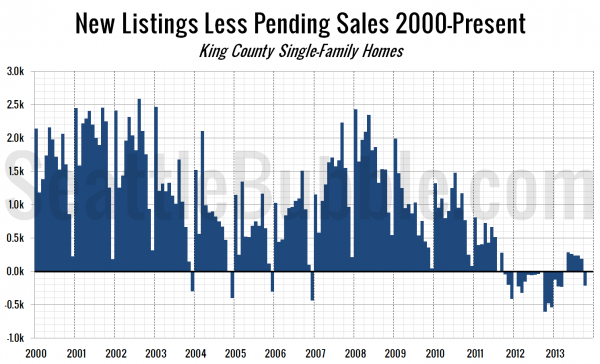
The next chart shows the difference between the number of new listings each month and the number of pending sales. Prior to late 2011 this number was almost always positive, except in December, when very few new listings hit the market. From October 2011 through March 2013 this measure was negative, indicating very tight inventory.
In October this flipped back into negative territory, where it will most likely stay through the end of the year, given the typical seasonal patterns.
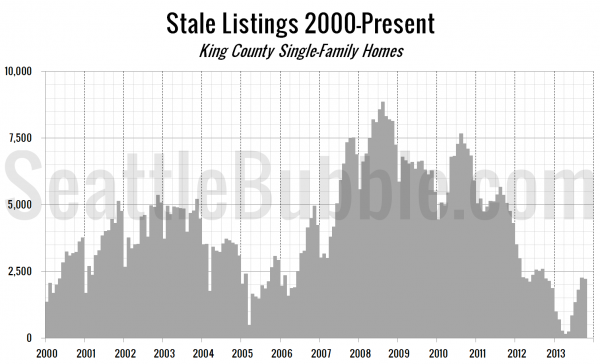
Finally, let’s take a look at the “stale listings” measure, which uses the total listings, new listings, and pending sales counts to estimate how many listings are “carried over” from one month to the next.
Stale listings in October were pretty much on par with where they were in September.
Listings typically decrease fairly dramatically during the last few months of the year, and this year is not likely to be an exception. However, given the shift we saw beginning around May, with decreasing inventory finally turning into increasing inventory, it seems likely that next year will shape up with a much more substantial gain in listings.


