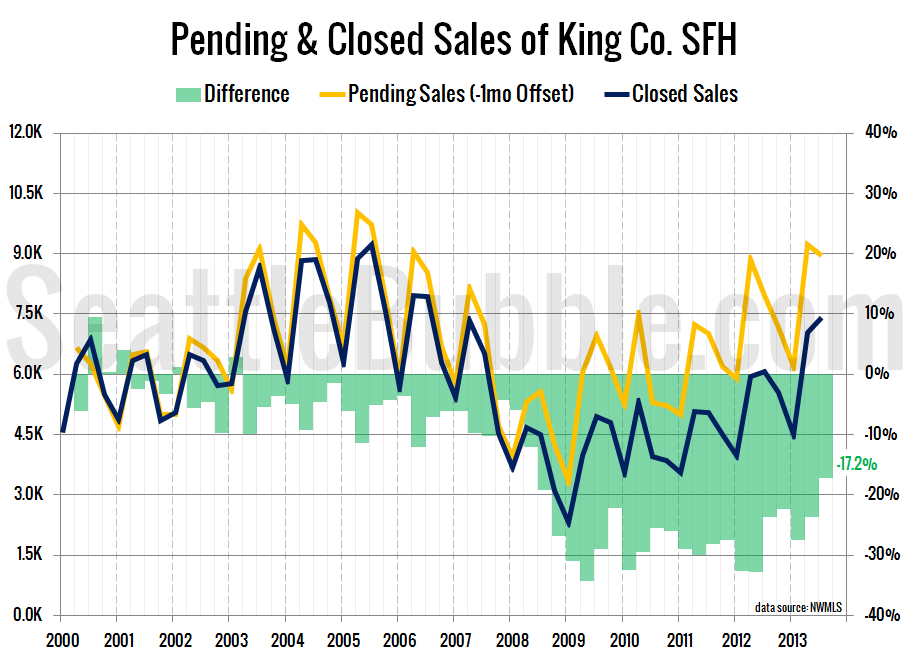
Let’s take a look a the latest data on pending sales volume versus closed sales volume.
For this series I roll the pending sales and closed sales data up by quarter, with pending sales offset by one month. In other words, the third quarter numbers below represent pending sales from June, July, and August and closed sales from July, August, and September.
With last quarter’s numbers I commented that I was surprised that the gap between pending and closed sales had not yet begun to substantially shrink. Although in Q2 one in four pending sales did not close, that number shrank significantly in Q3, down to 17%, about one in six. This is the smallest gap since the second quarter of 2008. Of course this is still far above the 4.5% average difference between the two numbers from 2000 through 2007.
It’s interesting that as the market began to cool in the third quarter, the share of pending sales that failed to close fell. I think this indicates that while listings in a hot market might go pending very quickly, many deals fall apart as the buyers find out that they rushed into a less-than-ideal deal.

