It’s time once again to take an updated look at how King County’s sales are shifting between the different regions around the county, since geographic shifts can and do affect the median price.
In order to explore this concept, we break King County down into three regions, based on the NWMLS-defined “areas”:
- low end: South County (areas 100-130 & 300-360)
- mid range: Seattle / North County (areas 140, 380-390, & 700-800)
- high end: Eastside (areas 500-600)
Here’s where each region’s median prices came in as of February data:
- low end: $203,200-$370,000
- mid range: $332,000-$655,500
- high end: $501,475-$1,392,500
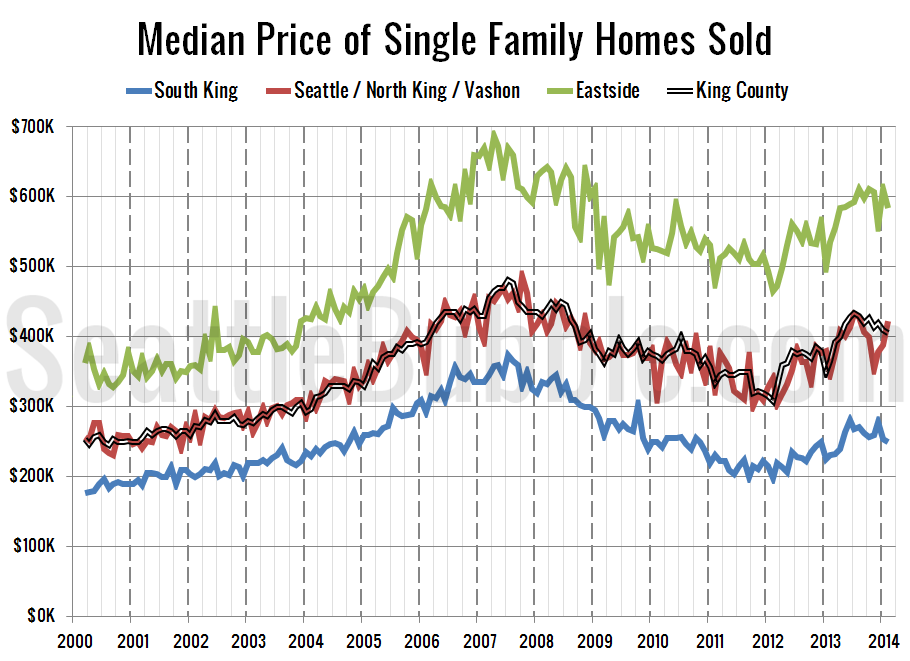
First up, let’s have a look at each region’s (approximate) median price (actually the median of the medians for each area within the region).
The median price in the middle tier rose between January and February, while the low and high tiers saw prices decrease. The low tier fell 1.8% in the month, the middle tier increased 8.8%, and the high tier lost 4.4%. Meanwhile, the median price in all three tiers is still up year-over-year. Here’s how the median prices changed year-over-year. Low tier: +7.7%, middle tier: +22.1%, high tier: +9.0%.
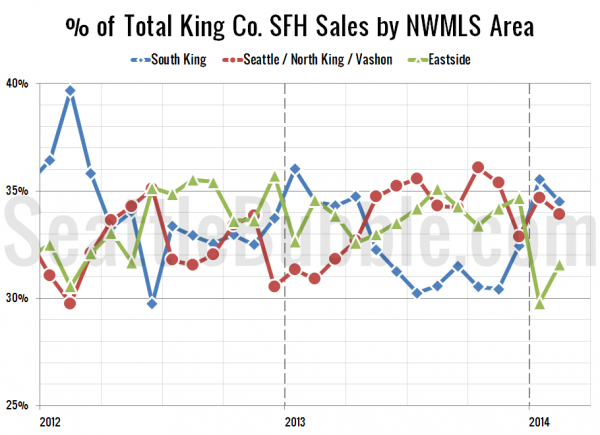
Next up, the percentage of each month’s closed sales that took place in each of the three regions.
Between December and January sales fell off dramatically in the expensive Eastside regions, while climbing in the mid and low range areas. The trend reversed slightly in February, but the Eastside still makes up the smallest portion of sales. Year-over-year sales were down 0.1% in the low tier, up 9.8% in the middle tier, and down 8.7% in the high tier.
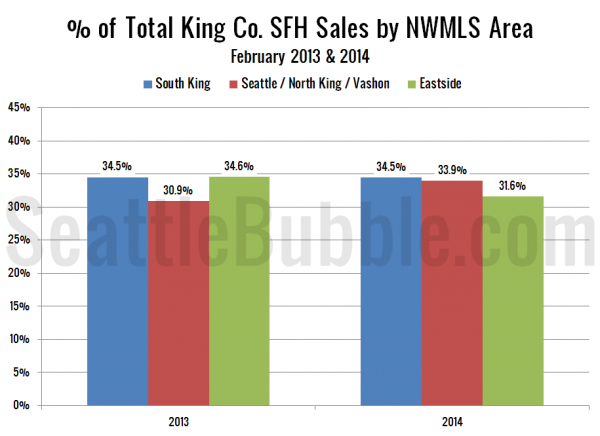
As of February 2014, 34.5% of sales were in the low end regions, 33.9% in the mid range, and 31.6% in the high end. A year ago the mid range had less of the share and the high range more: In February 2013 the low end made up 34.5% of the sales, the mid range was 30.9%, and the high end was 34.6%.
Here’s that information in a visual format:
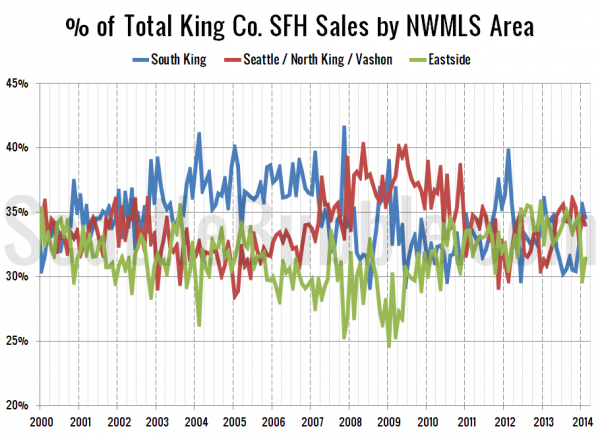
Finally, here’s an updated look at the percentage of sales data all the way back through 2000:
The high end regions typically have a smaller share of the monthly sales than the middle and low range regions, so this recent shift is really just the mix getting back to where it normally is. The disproportionate share of sales that the high end has been accounting for through 2012 and 2013 is certainly part of the reason the median price has gone up so much, and the decreasing share on the Eastside explains why it is going down over the last few months.
