It’s time for us to check up on stats outside of the King/Snohomish core with our “Around the Sound” statistics for Pierce, Kitsap, Thurston, Island, Skagit, and Whatcom counties.
If there is certain data you would like to see or ways you would like to see the data presented differently, drop a comment below and let me know.
First up, a summary table:
| February 2014 | King | Snohomish | Pierce | Kitsap | Thurston | Island | Skagit | Whatcom |
|---|---|---|---|---|---|---|---|---|
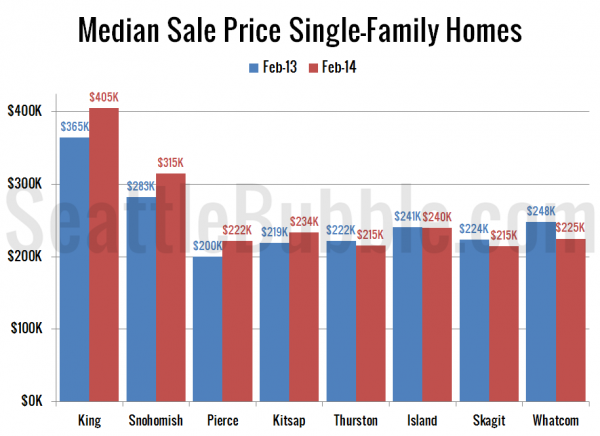
| Median Price | $405,000 | $315,000 | $222,000 | $234,000 | $215,350 | $240,000 | $215,000 | $225,000 |
| Price YOY | 11.0% | 11.5% | 11.1% | 6.6% | -3.1% | -0.4% | -3.8% | -9.3% |
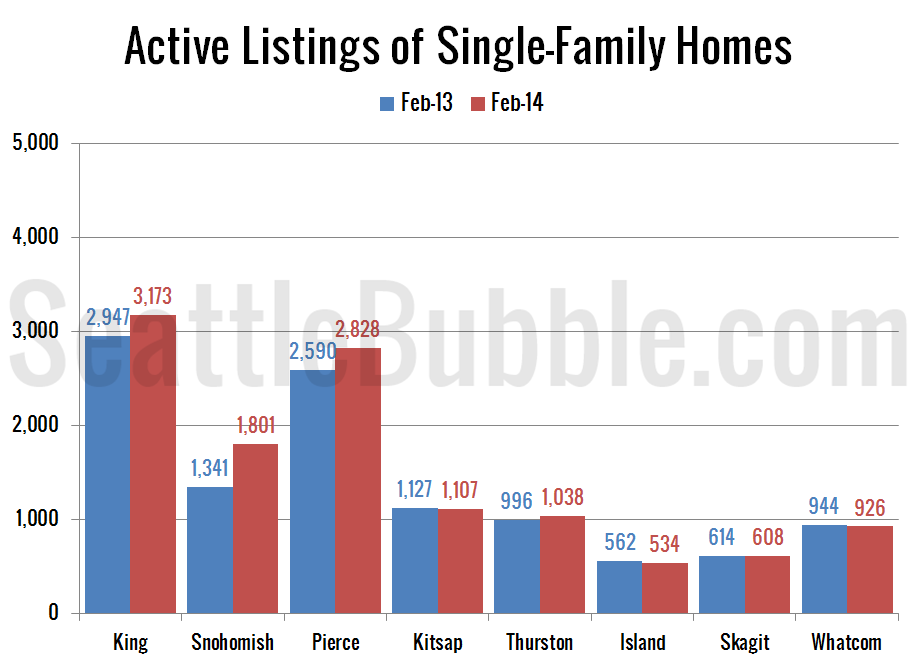
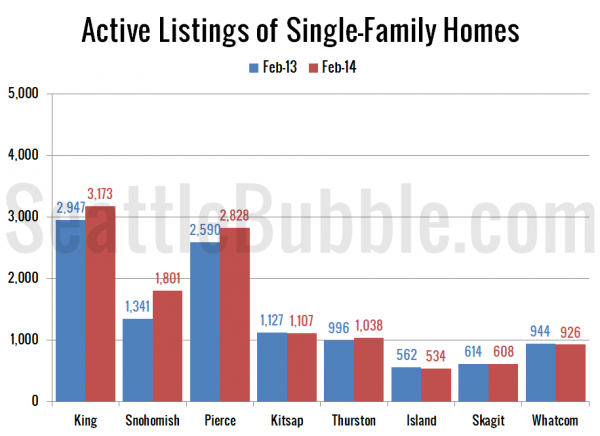
| Active Listings | 3,173 | 1,801 | 2,828 | 1,107 | 1,038 | 534 | 608 | 926 |
| Listings YOY | 7.7% | 34.3% | 9.2% | -1.8% | 4.2% | -5.0% | -1.0% | -1.9% |
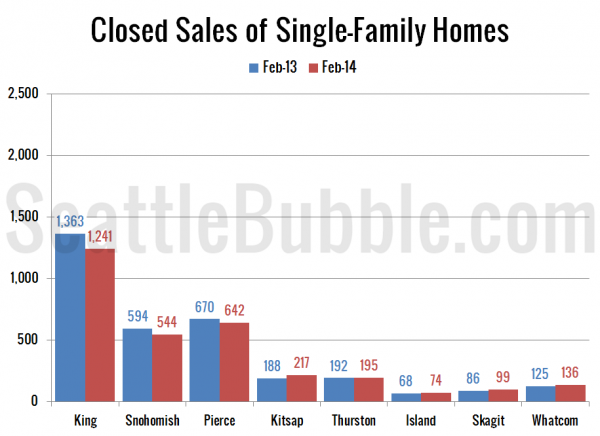
| Closed Sales | 1,241 | 544 | 642 | 217 | 195 | 74 | 99 | 136 |
| Sales YOY | -9.0% | -8.4% | -4.2% | 15.4% | 1.6% | 8.8% | 15.1% | 8.8% |
| Months of Supply | 2.6 | 3.3 | 4.4 | 5.1 | 5.3 | 7.2 | 6.1 | 6.8 |
Next we’ll have a look at median prices in February compared to a year earlier. The biggest price gains in February were in King, Snohomish, and Pierce counties, which all came in around 11 percent higher than a year ago. Prices also rose in Kitsap County, but were down year-over-year in Thurston, Island, Skagit, and Whatcom.
Listings are increasing year-over-year in King, Snohomish, Pierce, and Thurston. Listings were down from a year ago in Kitsap, Island, Skagit, and Whatcom. Snohomish county is still way ahead of the the pack with gains over 30 percent from last year.
Closed sales fell in February in King, Snohomish, and Pierce, but were up from a year ago in all the other counties.
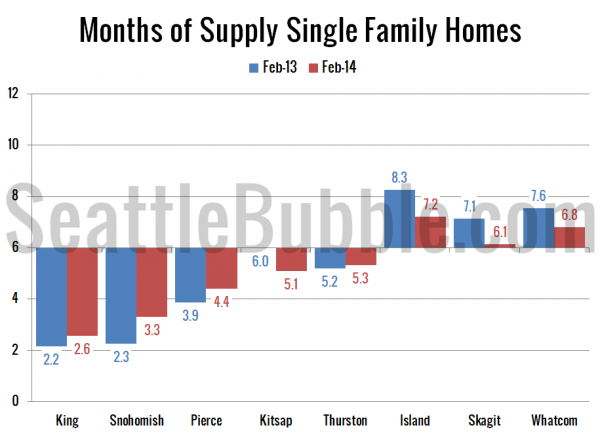
Here’s a chart showing months of supply this February and last February. Every county but Kitsap was more balanced this February than it was a year ago. For King, Snohomish, Pierce, and Thurston that means that months of supply went up, but are still in seller’s market territory. In Island, Skagit, and Whatcom months of supply fell, but is still in buyer’s market territory. Kitsap was balanced last year but moved into seller’s market territory this year.
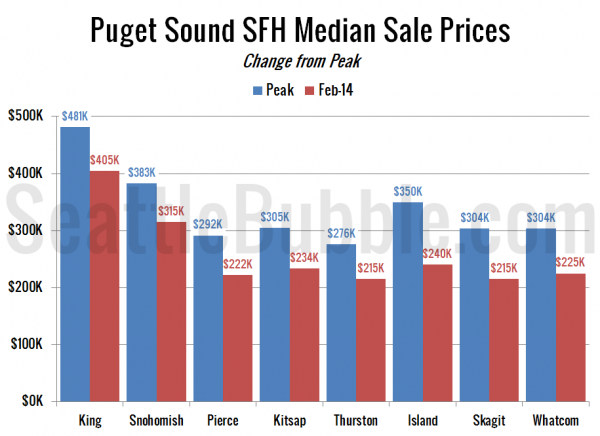
To close things out, here’s a chart comparing February’s median price to the peak price in each county. Everybody is still down between 15 percent (King) and 31 percent (Island).
The close-in counties (King, Snohomish, Pierce, and sometimes Thurston) are currently acting quite a bit differently than the outlying areas, with sales decreasing and listings increasing. Of course, these areas saw the most extreme frenzy last year so it is no surprise that things are beginning to settle down.
