It’s time for us to check up on stats outside of the King/Snohomish core with our “Around the Sound” statistics for Pierce, Kitsap, Thurston, Island, Skagit, and Whatcom counties.
If there is certain data you would like to see or ways you would like to see the data presented differently, drop a comment below and let me know.
This month’s story in a nutshell: Supply growth slowed while sales strengthened a bit in King & Snohomish, but fell elsewhere.
First up, a summary table:
| June 2014 | King | Snohomish | Pierce | Kitsap | Thurston | Island | Skagit | Whatcom |
|---|---|---|---|---|---|---|---|---|
| Median Price | $453,500 | $340,000 | $234,925 | $250,000 | $239,950 | $266,249 | $233,000 | $279,000 |
| Price YOY | 6.1% | 13.3% | 4.5% | 1.0% | 6.6% | 1.4% | 1.3% | 8.4% |
| Active Listings | 4,452 | 2,388 | 3,573 | 1,379 | 1,345 | 770 | 792 | 1,371 |
| Listings YOY | 5.9% | 33.3% | 19.3% | -0.6% | 16.0% | -9.8% | 1.3% | 4.7% |
| Closed Sales | 2,476 | 991 | 1,006 | 383 | 338 | 132 | 147 | 257 |
| Sales YOY | 2.2% | 2.3% | -3.0% | -12.6% | -19.1% | -23.3% | -23.8% | -11.1% |
| Months of Supply | 1.8 | 2.4 | 3.6 | 3.6 | 4.0 | 5.8 | 5.4 | 5.3 |
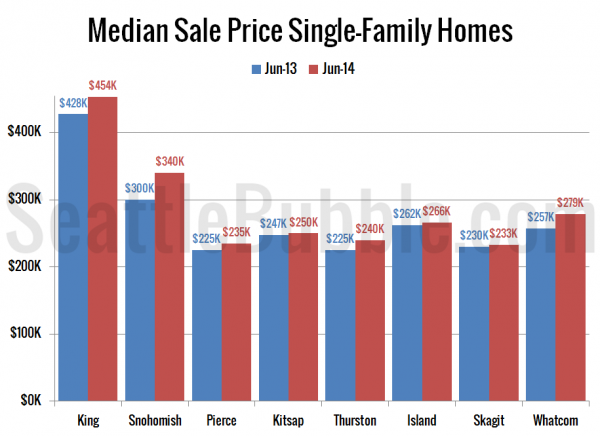
Next let’s take a look at median prices in June compared to a year earlier. Prices were up from a year ago across the board. Gains ranged from as low as 1 percent in Kitsap to as high as 13 percent in Snohomish.
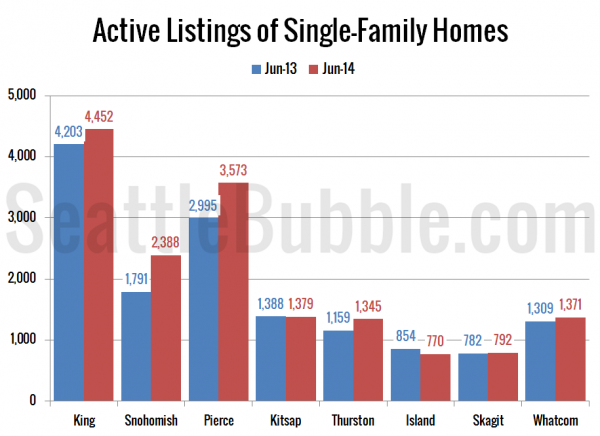
The number of listings grew year-over-year everywhere but Kitsap and Island counties. The biggest gainer by far was again Snohomish County at +33 percent, but Pierce and Thurston both also saw double-digit gains in inventory.
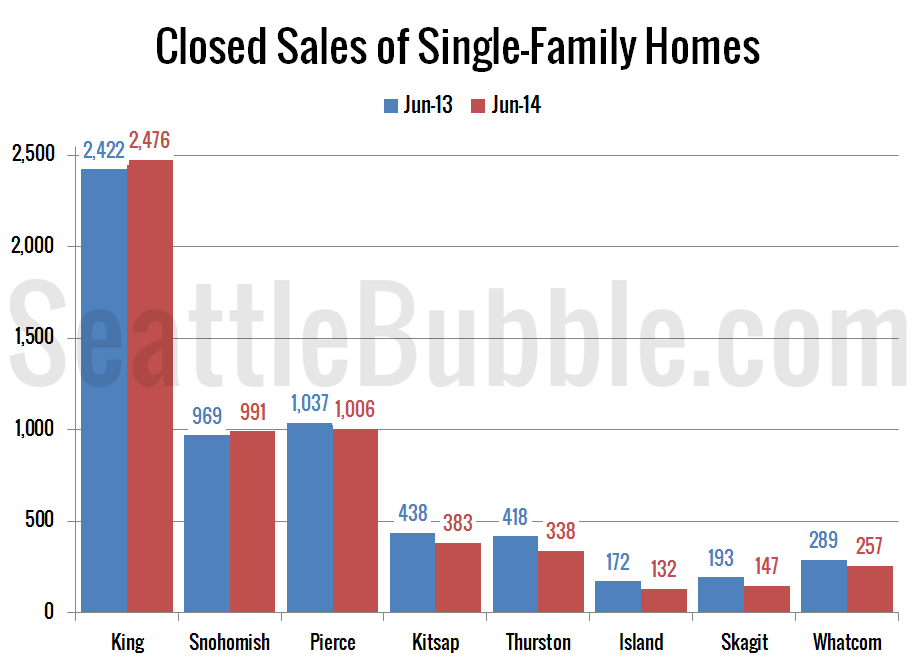
Closed sales fell in June compared to a year earlier everywhere but King and Snohomish, which both saw gains just over two percent. The biggest decline in sales were in Island and Skagit Counties, where sales fell over 23 percent from June 2013.
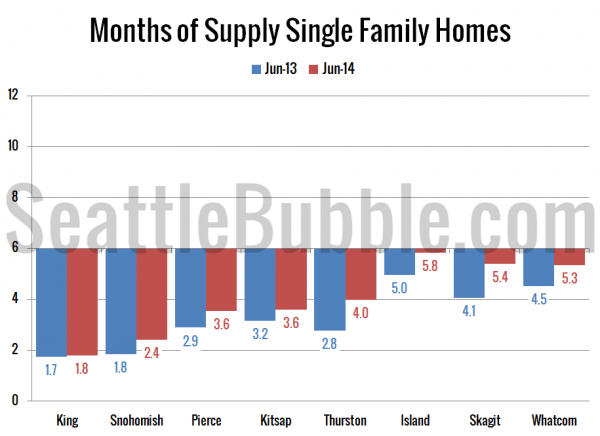
Here’s a chart showing months of supply this June and last June. The market was more balanced than a year ago in every Puget Sound county, but they’re also all still in seller’s market territory.
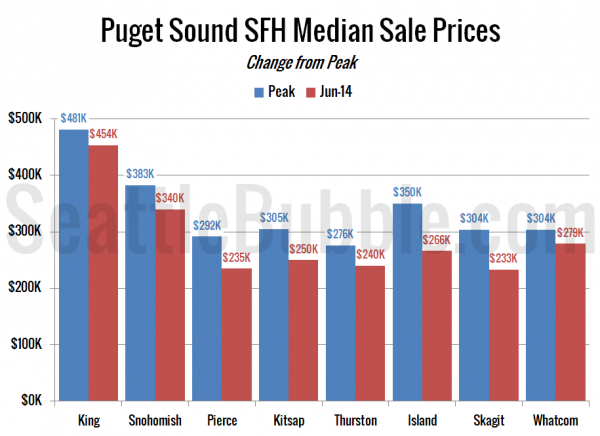
To close things out, here’s a chart comparing June’s median price to the peak price in each county. Everybody is still down from the peak, with drops ranging between 6 percent (King) and 24 percent (Island).
Still moving at a snail’s pace toward a more balanced market across most of the Sound.
