Continuing our “Another Bubble?” series, it’s time to take a look at the affordability index.
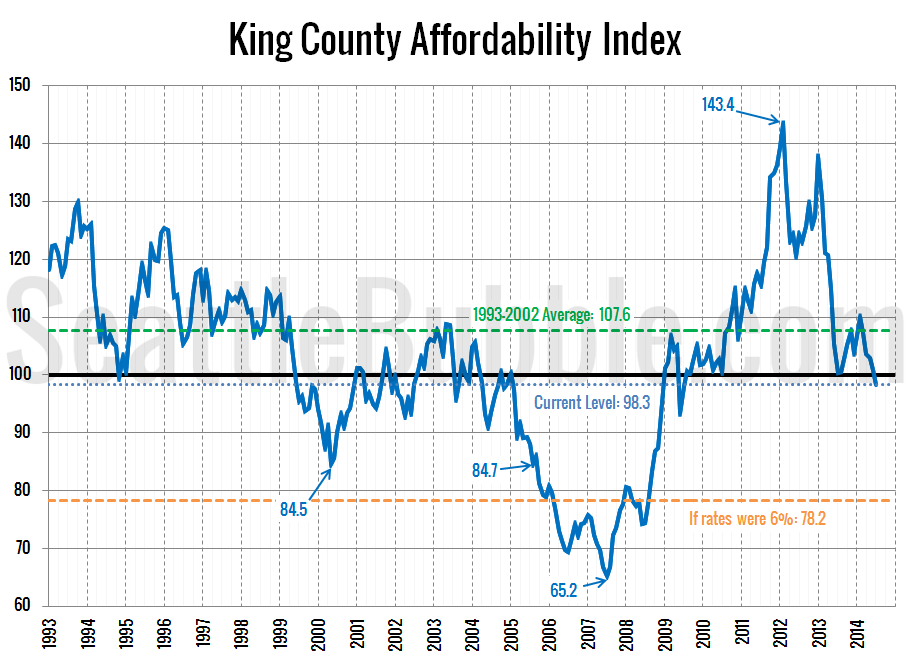
As King County’s median home price has surged from $405,400 in February to $468,000 in July, the affordability index has dropped from slightly above the long-term average to just below 100.
An index level above 100 indicates that the monthly payment on a median-priced home costs less than 30% of the median household income.
The current level of the affordability index is comparable to where it was at in 2010, 2003, and 1999. It’s probably most similar to 1999, given how much the level has fallen in the last two and a half years.
I’ve marked where affordability would be if interest rates were at a more sane level of 6%—78.2. That’s 6.5 points lower than the level the index was at when I started this blog in August 2005 (rates were 5.8% at the time).
If interest rates were anywhere near a “normal” level, today’s home prices would be well into bubble territory.
The only thing sustaining today’s “affordability” is crazy-low interest rates.
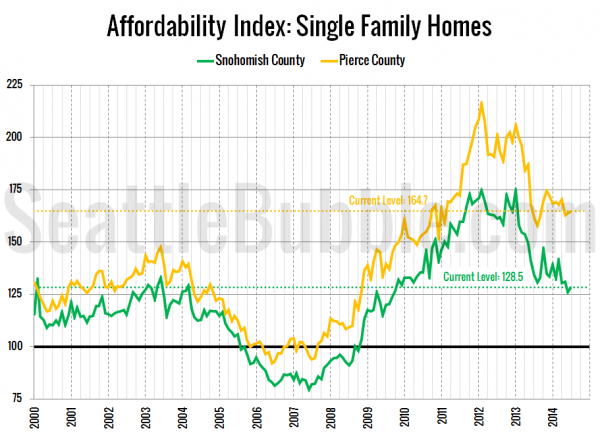
Here’s a look at the index for Snohomish County and Pierce County since 2000:
Affordability in Snohomish and Pierce are doing better than King County. In Snohomish the index currently sits close to the highest levels seen between 2000 and 2004, while Pierce County is still 12 percent higher than its highest level during that pre-bubble period.
The “another bubble” picture for affordability looks much the same as it does for the price-to-rent and price-to-income ratios: We’re not necessarily in another housing bubble yet, but we’re headed there fast if the brakes aren’t applied to this market almost immediately. Look at affordability, we also realize that basically the only reason the current home prices aren’t in bubble territory is today’s still-insanely-low interest rates.
Methodology
The affordability index is based on three factors: median single-family home price as reported by the NWMLS, 30-year monthly mortgage rates as reported by the Federal Reserve, and estimated median household income as reported by the Washington State Office of Financial Management.
The historic standard for “affordable” housing is that monthly costs do not exceed 30 percent of a household’s gross income. Therefore, the formula for the affordability index is as follows:
For a more detailed examination of what the affordability index is and what it isn’t, I invite you to read this 2009 post. Or, to calculate your the affordability of your own specific income and home price scenario, check out my Affordability Calculator.
Note that the data from 2013 and early 2014 in the charts above looks a little different from what I’ve published earlier this year, since I updated median household incomes with the latest data from OFM.


