Category: Statistics,Neighborhoods
Tags: King-geographic-sales,median,NWMLS,REO,Statistics
It’s time once again to take an updated look at how King County’s sales are shifting between the different regions around the county, since geographic shifts can and do affect the median price.
In order to explore this concept, we break King County down into three regions, based on the NWMLS-defined “areas”:
- low end: South County (areas 100-130 & 300-360)
- mid range: Seattle / North County (areas 140, 380-390, & 700-800)
- high end: Eastside (areas 500-600)
Here’s where each region’s median prices came in as of September data:
- low end: $250,000-$416,500
- mid range: $338,500-$731,000
- high end: $495,000-$1,547,500
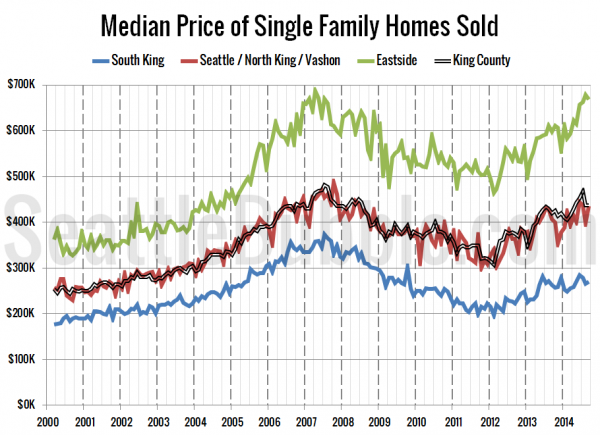
First up, let’s have a look at each region’s (approximate) median price (actually the median of the medians for each area within the region).
The median price in the low and middle tiers rose between August and September, but the high tier slipped. The low tier rose 1.3 percent in the month, the middle tier increased 9.3 percent, and the high tier lost 1.4 percent.
Twenty-three of the twenty-nine NWMLS regions in King County with single-family home sales in September had a higher median price than a year ago, while just sixteen had a month-over-month increase in the median price.
Here’s how the median prices changed year-over-year. Low tier: up 2.7 percent, middle tier: up 7.0 percent, high tier: up 12.0 percent.
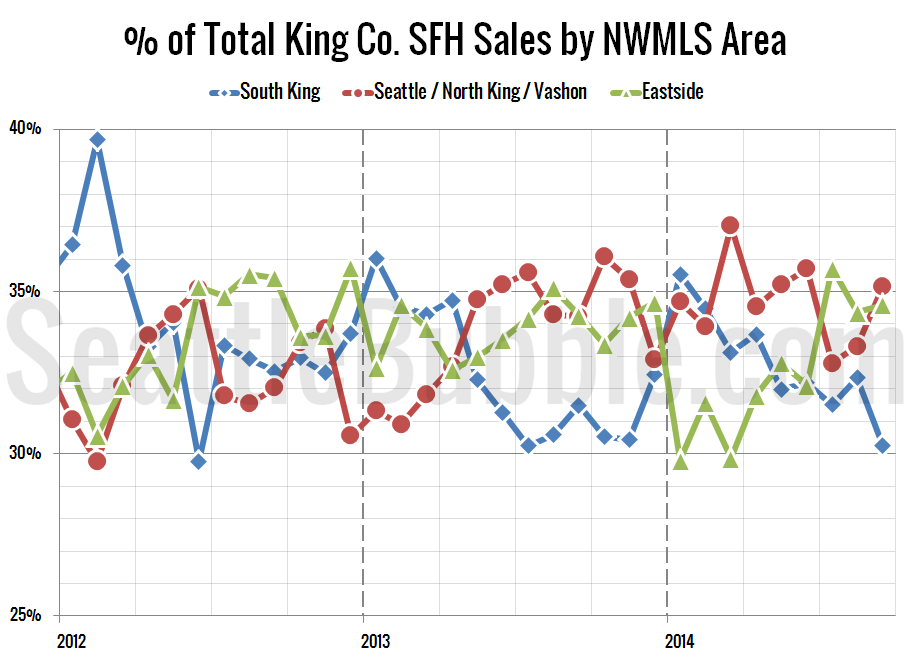
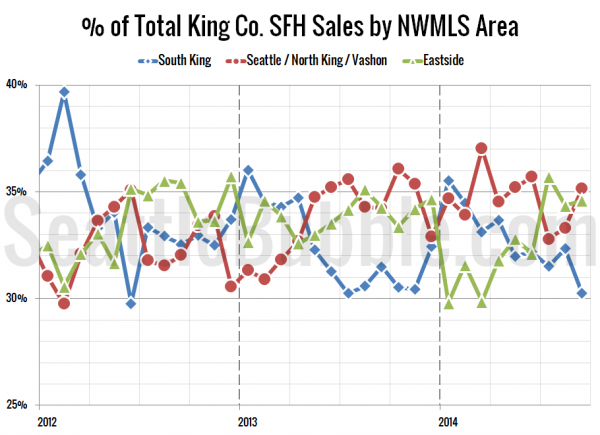
Next up, the percentage of each month’s closed sales that took place in each of the three regions.
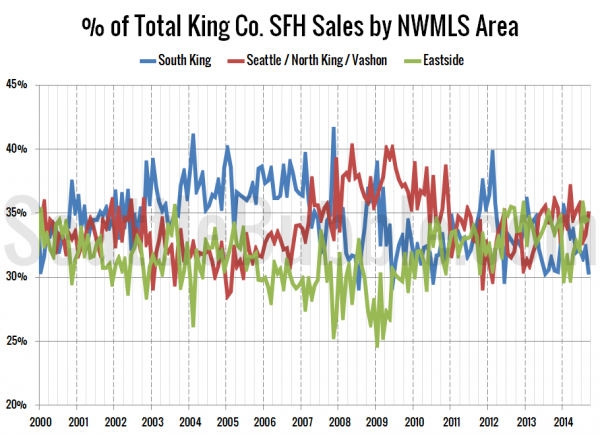
The share of sales in the middle and high tiers of Seattle and the Eastside both gained ground in September, while South King County sales dipped. Yet again, this shift in the geographic sales mix explains the dramatic month-over-month change in the county-wide median price.
Year-over-year sales were down in all three tiers. Compared to a year ago, sales decreased 7.8 percent in the low tier, fell 1.3 percent in the middle tier, and dropped 3.1 percent in the high tier.
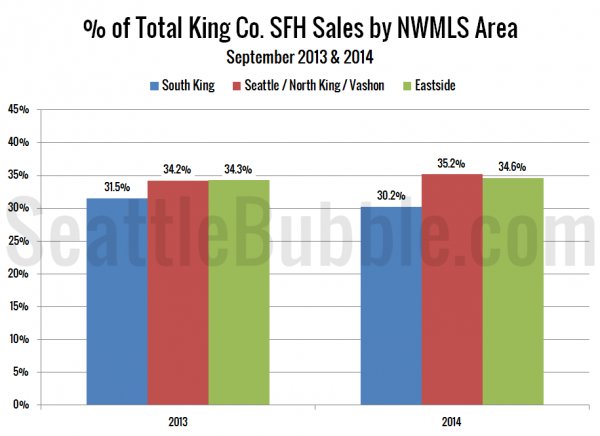
As of September 2014, 30.2 percent of sales were in the low end regions (down from 31.5 percent a year ago), 35.2 percent in the mid range (up from 34.2 percent a year ago), and 34.6 percent in the high end (up from 34.3 percent a year ago).
Here’s that information in a visual format:
Finally, here’s an updated look at the percentage of sales data all the way back through 2000:
Once again the big shift in the county-wide median price (up 5.3 percent in a month after falling 6.6 percent the month before) is driven almost entirely by the shift between less expensive and more expensive parts of the county.
