It’s time once again to take an updated look at how King County’s sales are shifting between the different regions around the county, since geographic shifts can and do affect the median price.
In order to explore this concept, we break King County down into three regions, based on the NWMLS-defined “areas”:
- low end: South County (areas 100-130 & 300-360)
- mid range: Seattle / North County (areas 140, 380-390, & 700-800)
- high end: Eastside (areas 500-600)
Here’s where each region’s median prices came in as of December data:
- low end: $252,500-$377,500
- mid range: $383,975-$719,000
- high end: $480,000-$1,960,000
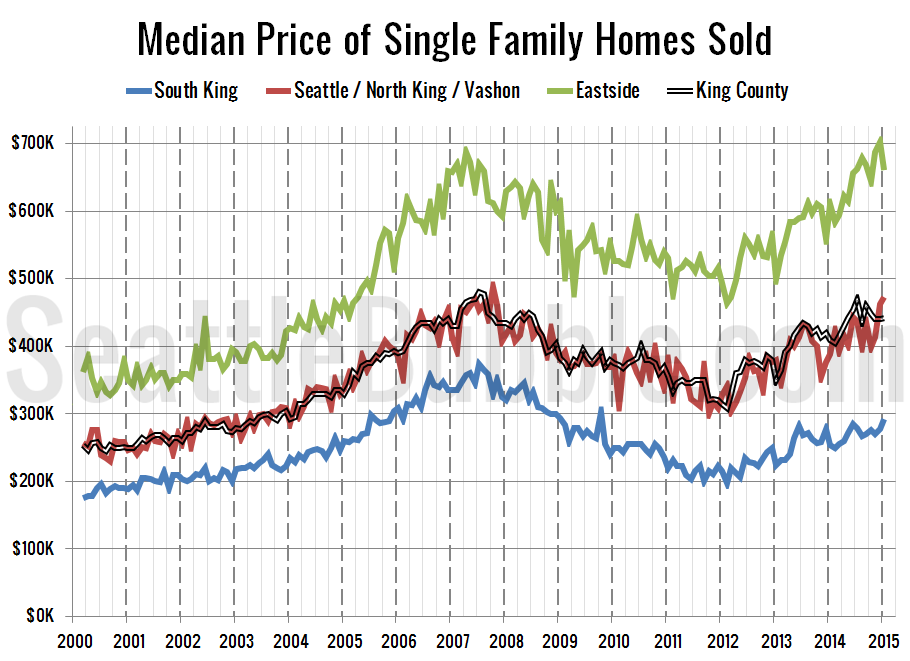
First up, let’s have a look at each region’s (approximate) median price (actually the median of the medians for each area within the region).
The median-median in the Eastside regions retreated from the all-time high set in December, falling from $703,200 to $660,600 in January. The median in the low and mid regions both increased slightly. Month-over-month, the median price in the low tier rose 5.3 percent, the middle tier increased 2.1 percent, and the high tier lost 6.1 percent.
Twenty-five of the twenty-nine NWMLS regions in King County with single-family home sales in January had a higher median price than a year ago, while sixteen had a month-over-month increase in the median price.
Here’s how the median prices changed year-over-year. Low tier: up 15.4 percent, middle tier: up 21.6 percent, high tier: up 8,2 percent.
Next up, the percentage of each month’s closed sales that took place in each of the three regions.
Sales in all three regions fell dramatically between December and January, and the mix changed slightly away from the Seattle middle tier and into the South King low tier. Month-over-month sales were down 28.6 percent in the low tier, down 35.7 percent in the middle tier, and down 32.9 percent in the high tier.
Year-over-year sales increased in the low and high tiers, but fell in the middle tier. Compared to a year ago, sales increased 2.8 percent in the low tier, fell 2.4 percent in the middle tier, and increased 7.4 percent in the high tier.
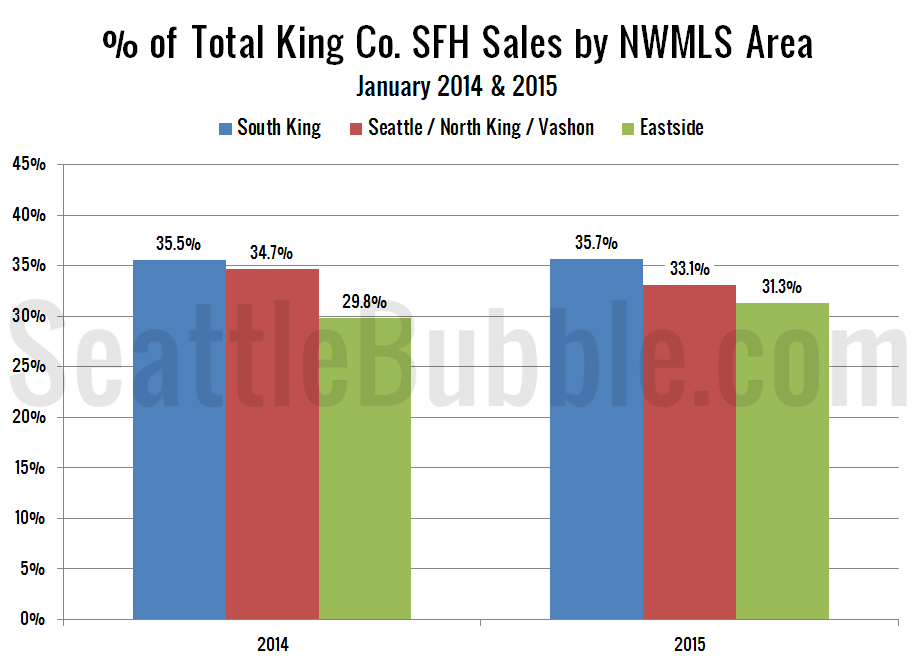
As of January 2015, 35.7 percent of sales were in the low end regions (up slightly from 35.5 percent a year ago), 33.1 percent in the mid range (down from 34.7 percent a year ago), and 31.3 percent in the high end (up from 29.8 percent a year ago).
Here’s that information in a visual format:
Finally, here’s an updated look at the percentage of sales data all the way back through 2000:
No big changes from the sellers’ market, but the year-over-year sales changes did weaken in January. It will be interesting to see if sales come roaring back this month.


